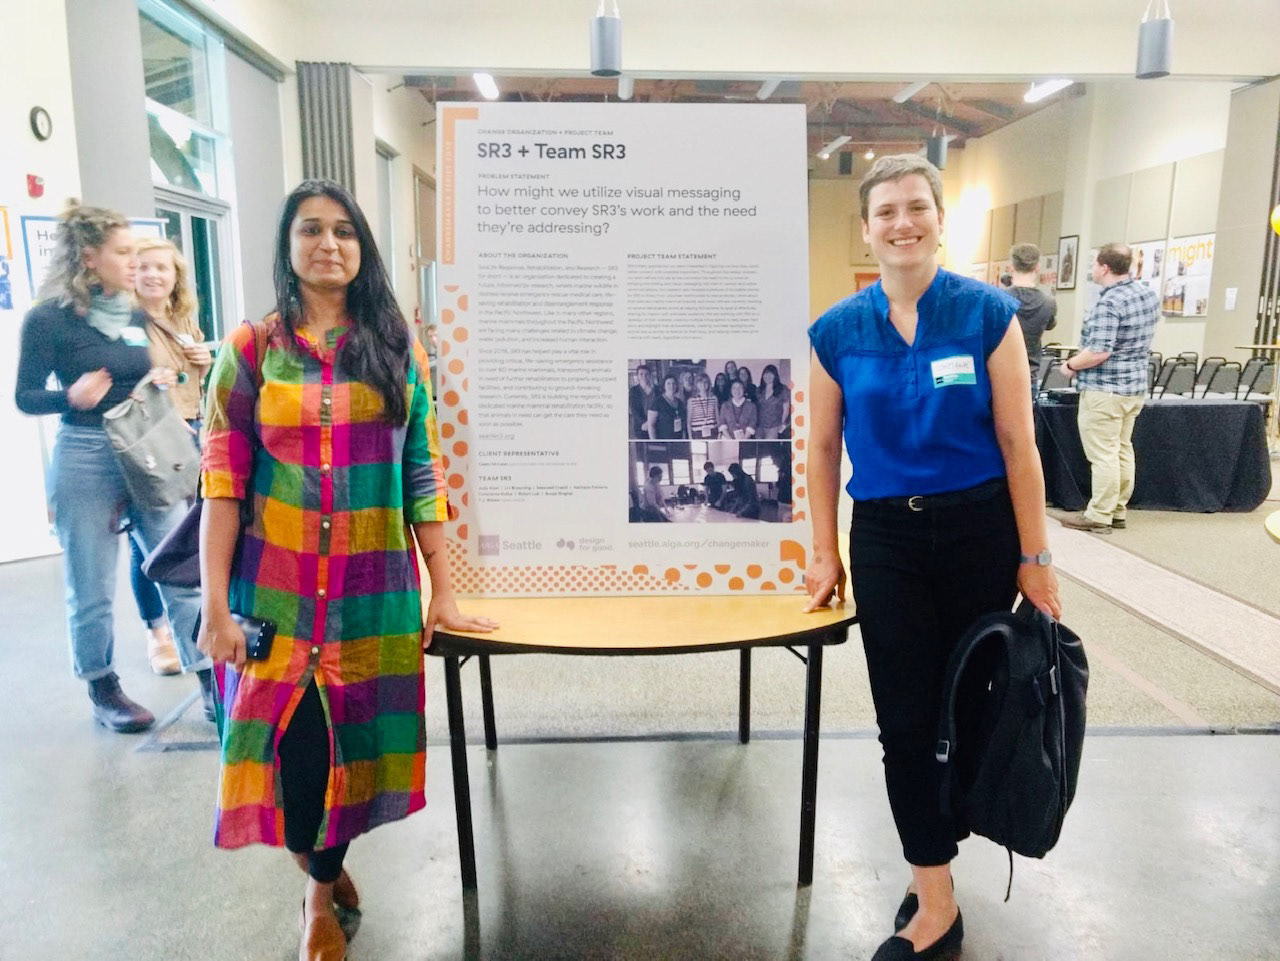
Project organized as part of the AIGA Changemaker Series 2019. 8 local non profits were paired with 8 small teams of researchers, strategists, writers and designers to help them solve a broad challenge statement. Teams are given 4 months to use Human Centered Design technics to define, analyze and implement a solution.
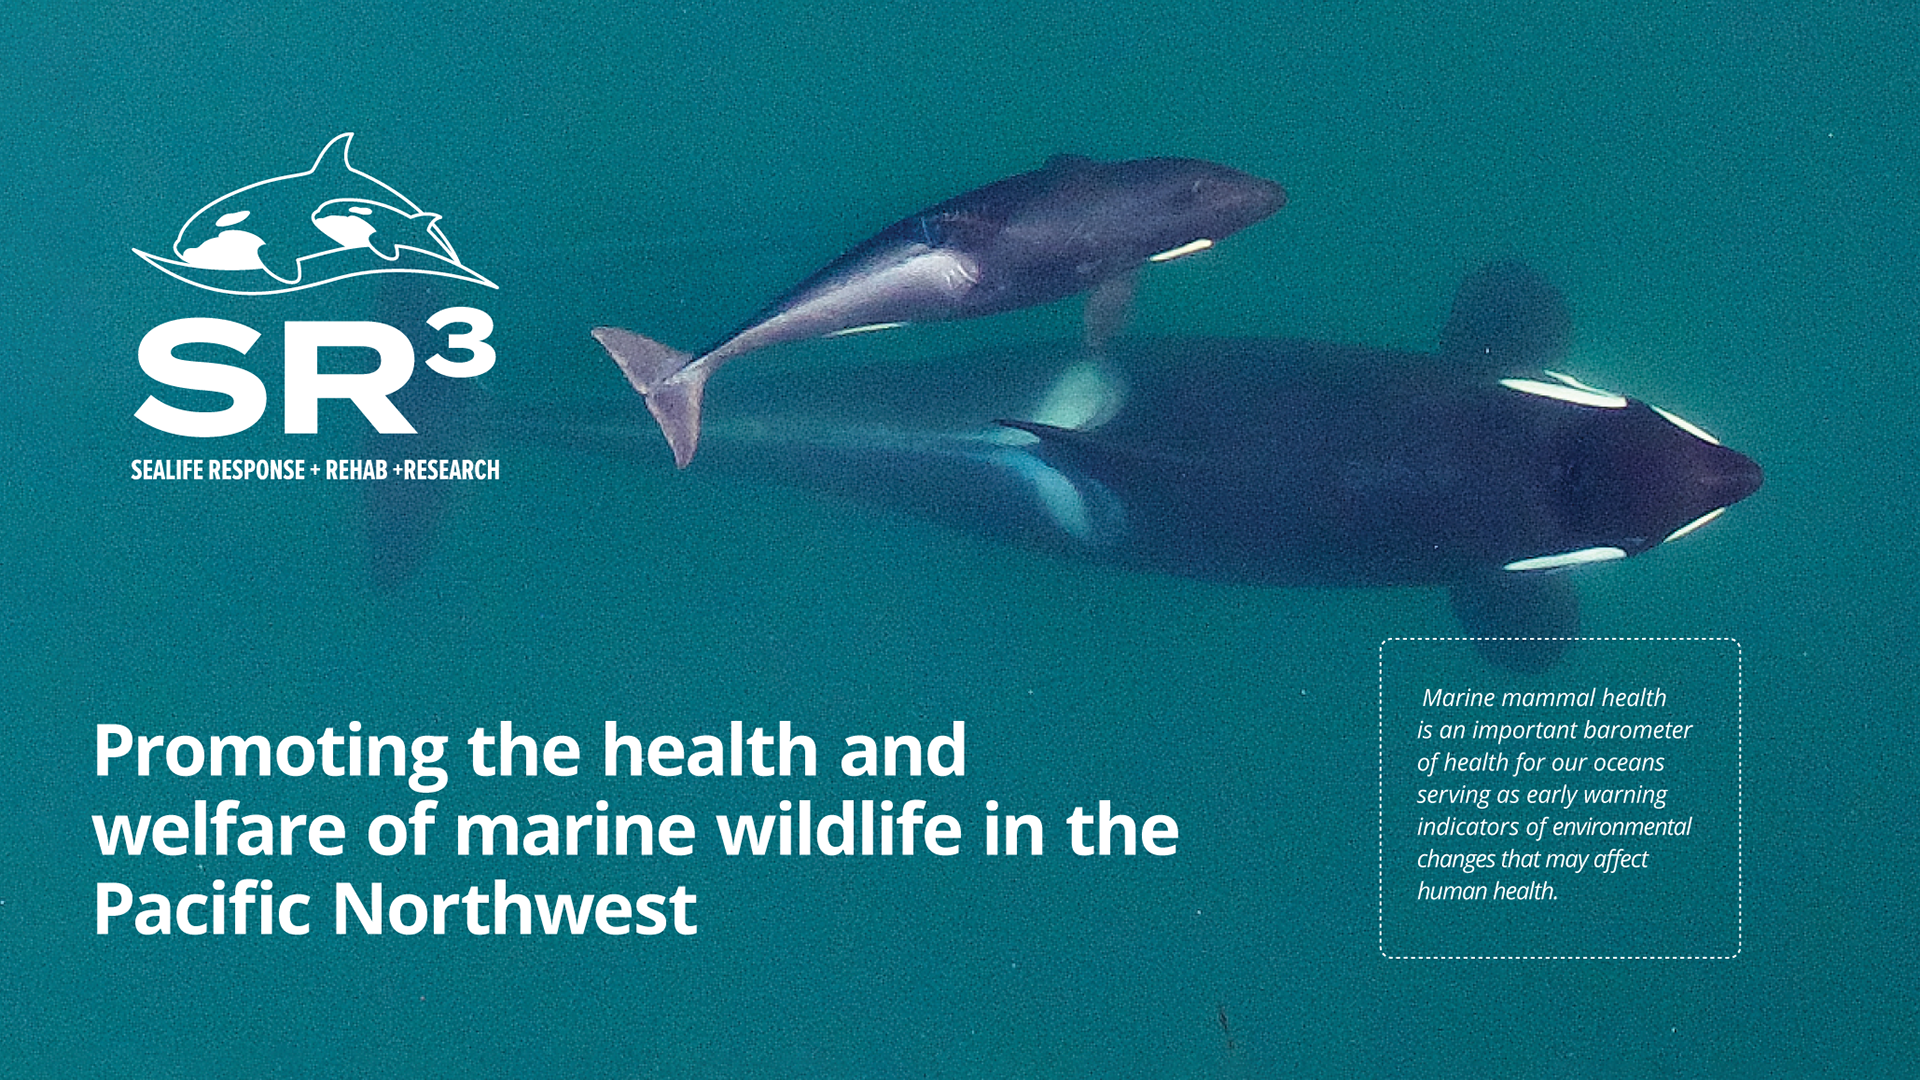
SR3 is a Pacific Northwestern Conservation Non Profit that conducts research, performs rescue operations and rehabilitates ailing, injured and endangered marine mammals of the PNW.
MY ROLE: Visual + UX Designer
Initial Challenge Statement:
How might we save more marine mammals?
02. RESEARCH
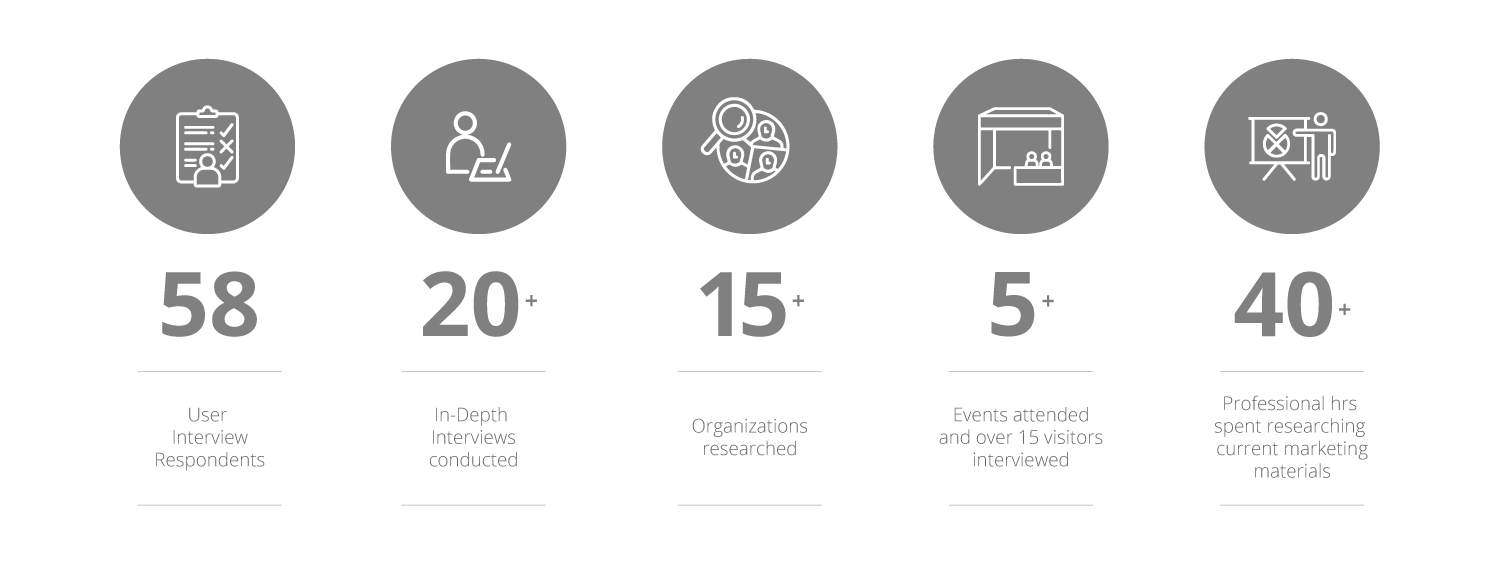
User Survey:
58 respondents, 100% are already involved with SR3 in some capacity, 20+ members willing to be interviewed
58 respondents, 100% are already involved with SR3 in some capacity, 20+ members willing to be interviewed
User Interviews (website and booth experience):
Over 20 in-depth user interviews and 15+ one-on-ones with booth visitors
Over 20 in-depth user interviews and 15+ one-on-ones with booth visitors
Observing SR3's presence at public events:
At 3 local events
At 3 local events
Competitive Analysis:
On 15 local and international animal welfare organizations and 3 inspirational non profits doing work in other specializations
On 15 local and international animal welfare organizations and 3 inspirational non profits doing work in other specializations
In-depth Analysis of current marketing material (website, booth collateral, messaging):
Professional review of SR3's current Logo, Tagline, Tonality, Mission Statement, Website structure, Call to Actions, Printed materials, and Booth Presence.
Professional review of SR3's current Logo, Tagline, Tonality, Mission Statement, Website structure, Call to Actions, Printed materials, and Booth Presence.
03. Understanding the Audience and Creating Journey Maps
The team created personas based on interactions with people who are already involved with SR3. We found that we were talking to broadly two kinds of personas: Anya and Margaret. Both personas came across SR3 through different channels and have different set of motivations and resources.
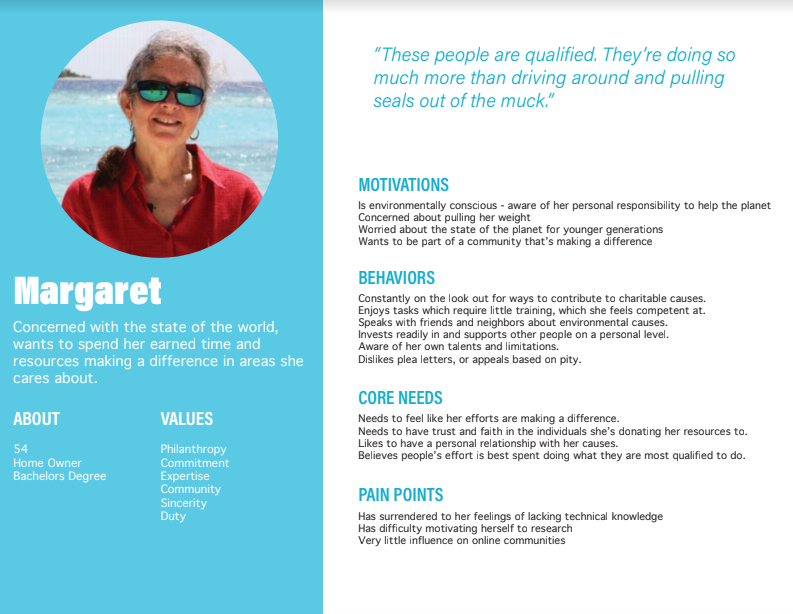
User Persona 1
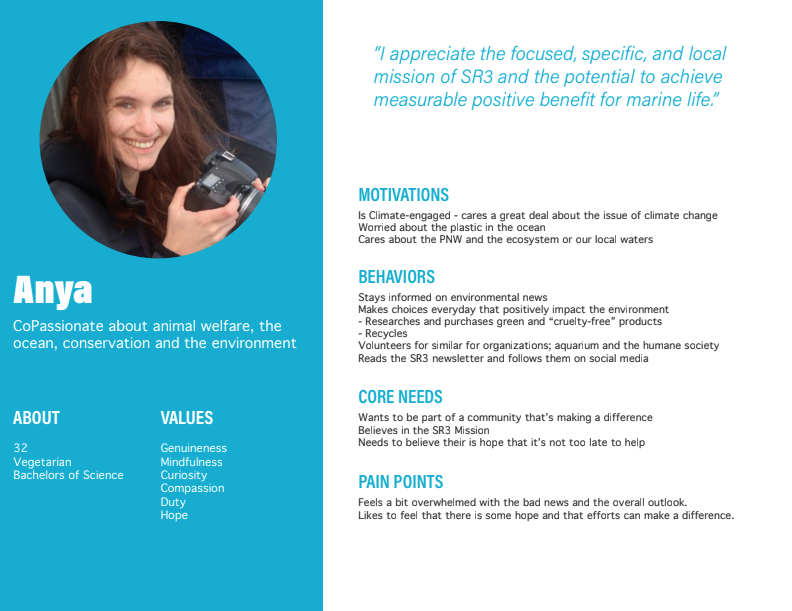
User Persona 2
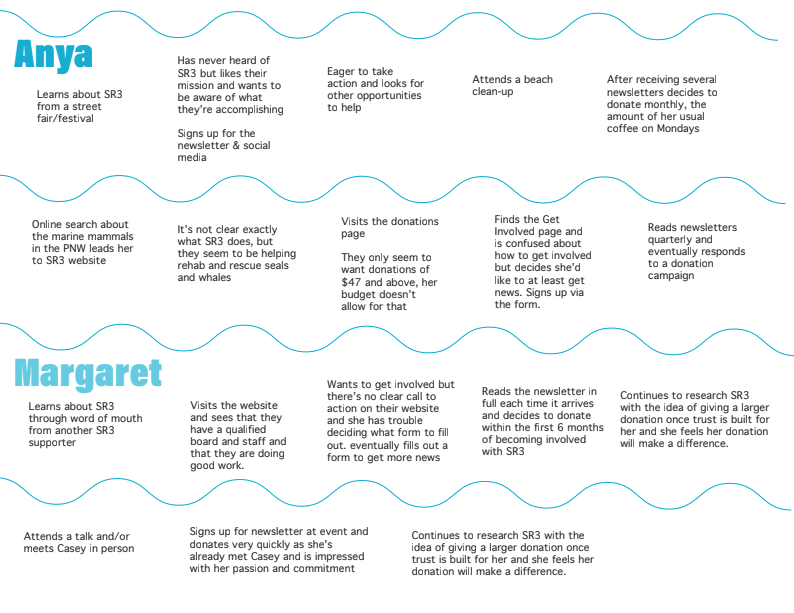
Jounrey Maps
04. Insights and Research Synthesis
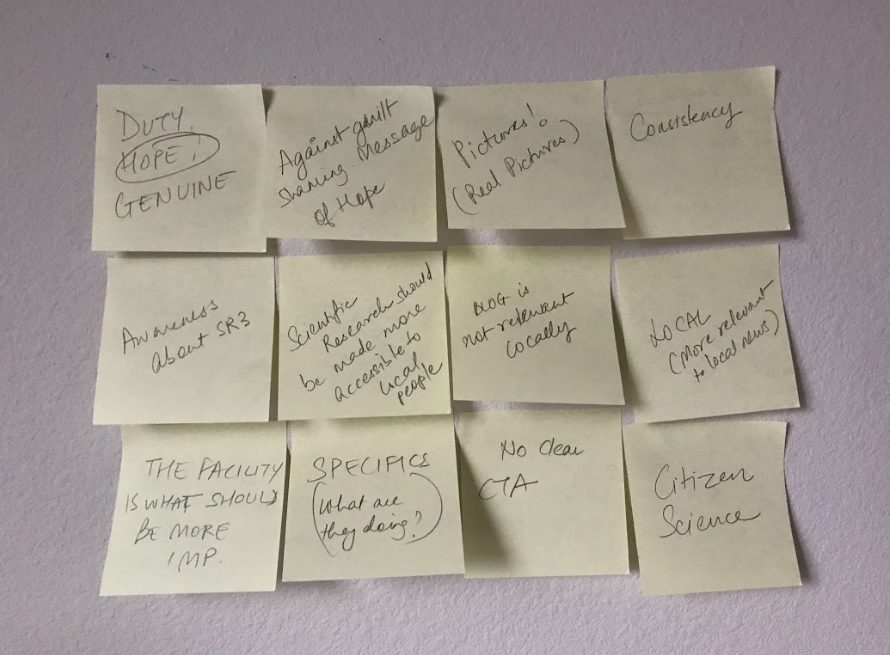
Based on our preliminary research as well as the now defined personas and client needs, the team identified some key problem areas and insights that needed attention.
• There seem to be a general lack of cohesive messaging and a compelling storyline that would give visitors (both online and offline) a glimpse of exactly what SR3 does and what is the impact of their work.
•. People are visually driven and hence seek compelling information and data that can be quick to scan and more emotionally appealing.
•. Even if they were somehow drawn to SR3's work and were convinced to get involved, they had a hard time understanding how to and how their contribution would actually help.
•. People were most drawn to the 'local' aspect of SR3's work and felt more connected to the cause, as it focused on a problem that was deeply rooted in the Pacific North Western waters.
• People wanted to feel like they're part of a community, passionate about the same things and supporting the same cause.
Redefined Problem Statement
How might we utilize visual messaging to better convey the work of SR3 and inspire people to get involved?
Equipped with a redefined problem statement, we drew out some common themes that needed to be tackled. We divided the team into sub-groups to focus on each of these themes to brainstorm ideas:
1. Data driven storytelling and consistent and concise messaging across media
2. Demonstrating impact and transparency in terms of future plans
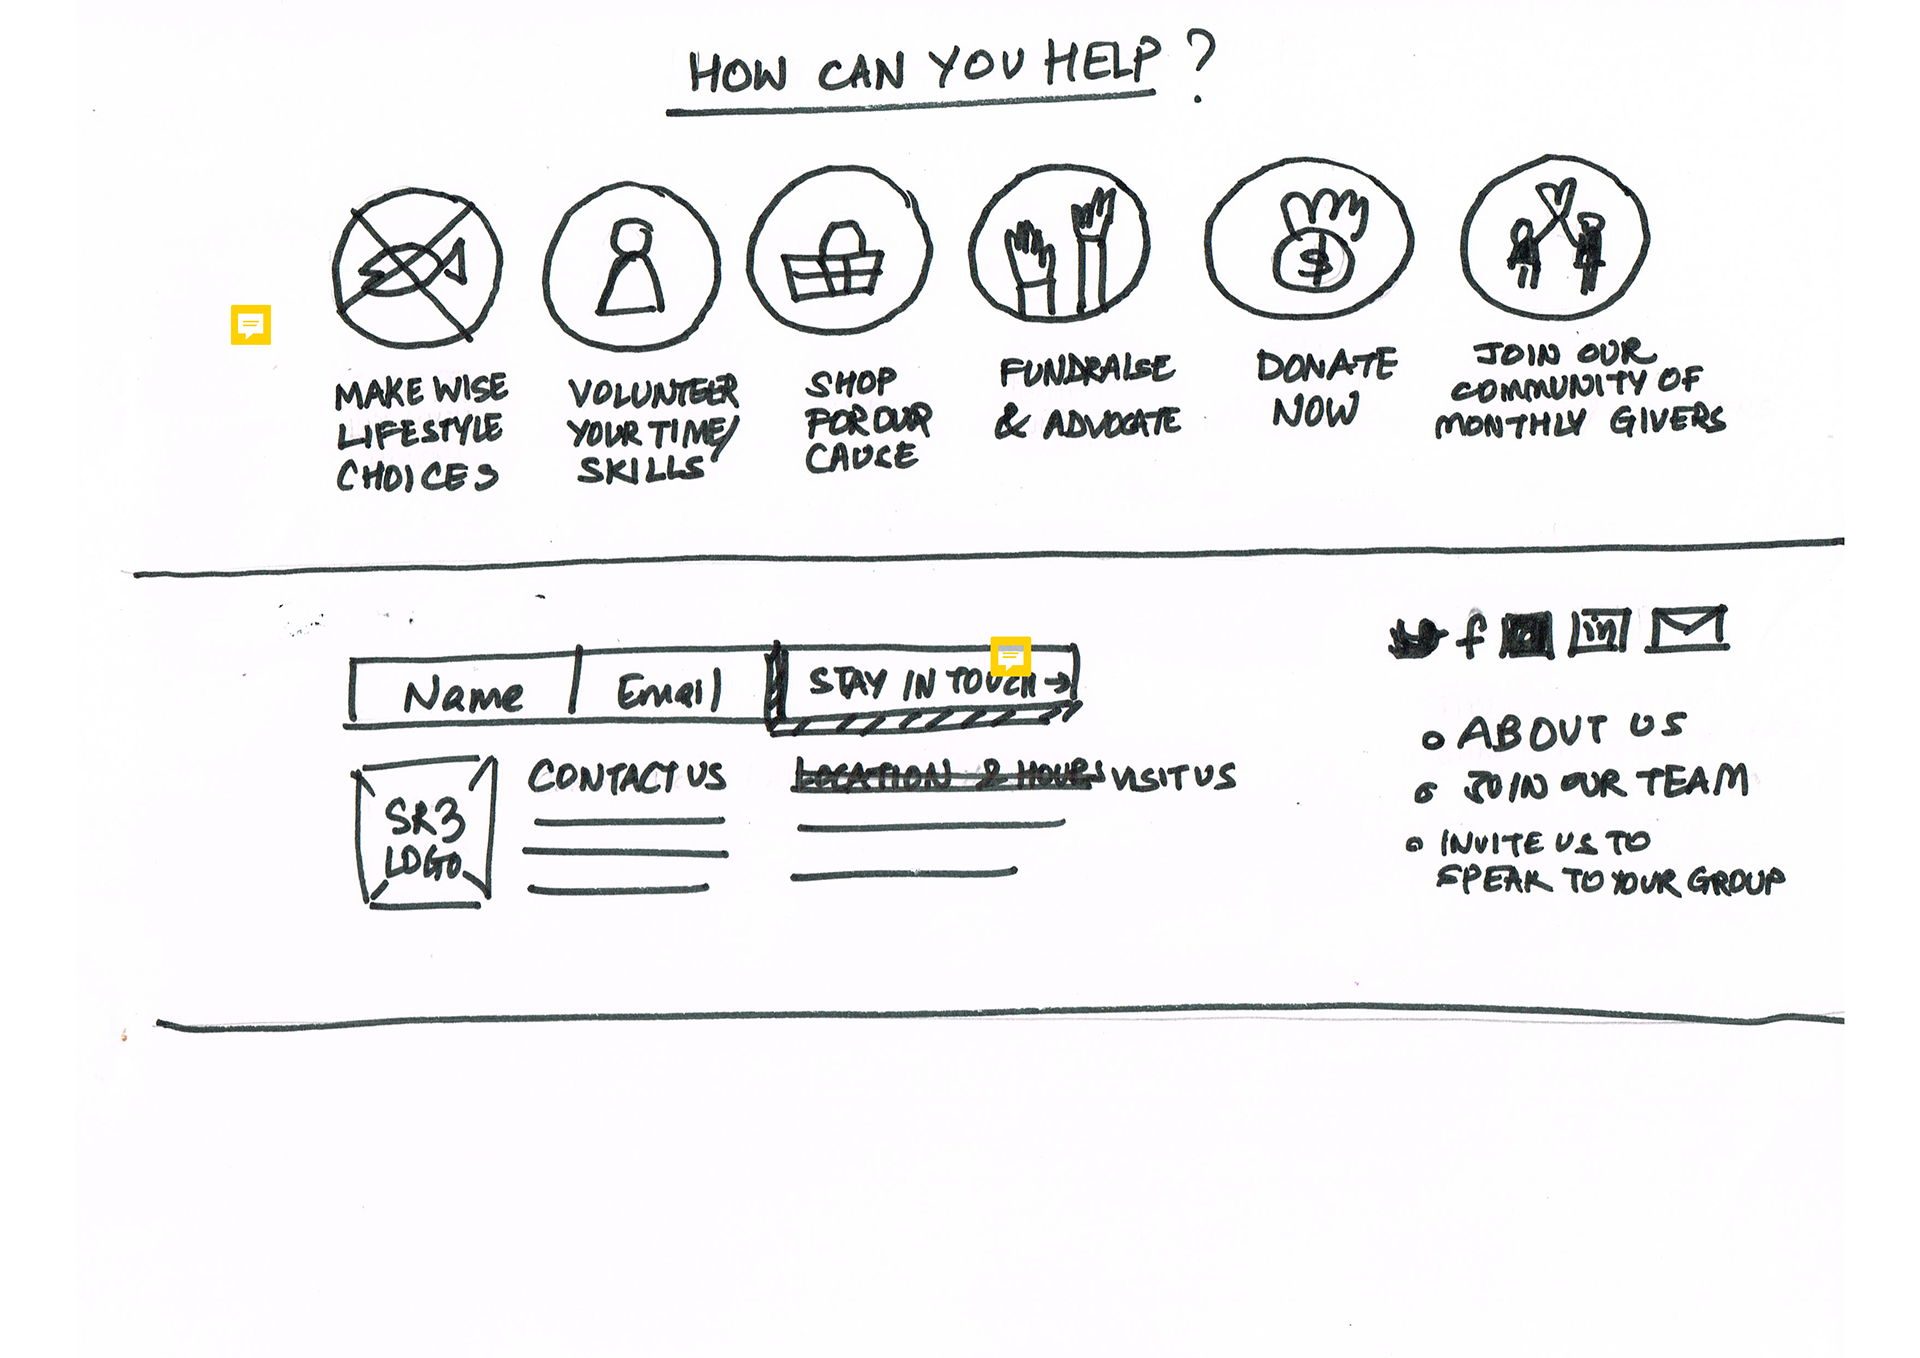
3. Having a clear set of call to actions that lead people into taking meaningful action
05. Idea brainstorm and Feasibility vs. Impact Analysis
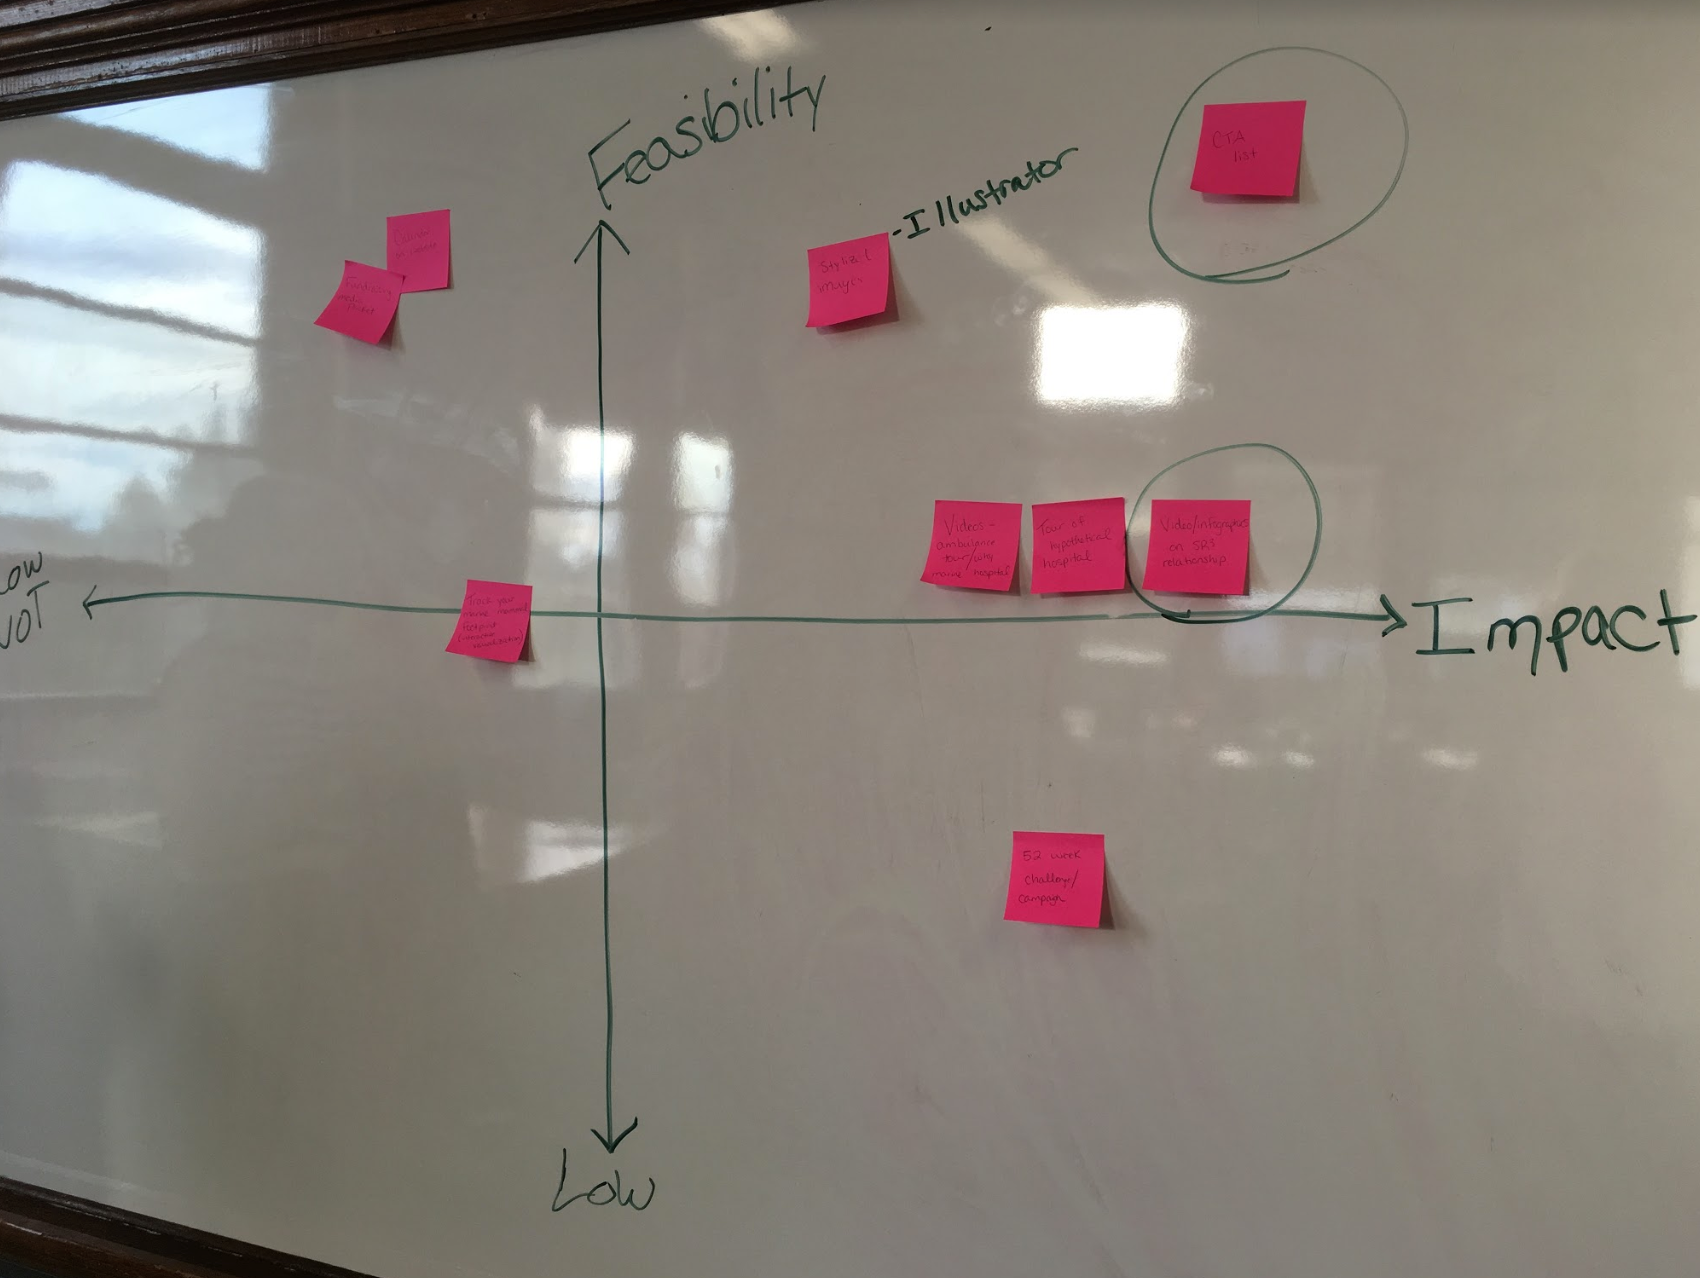
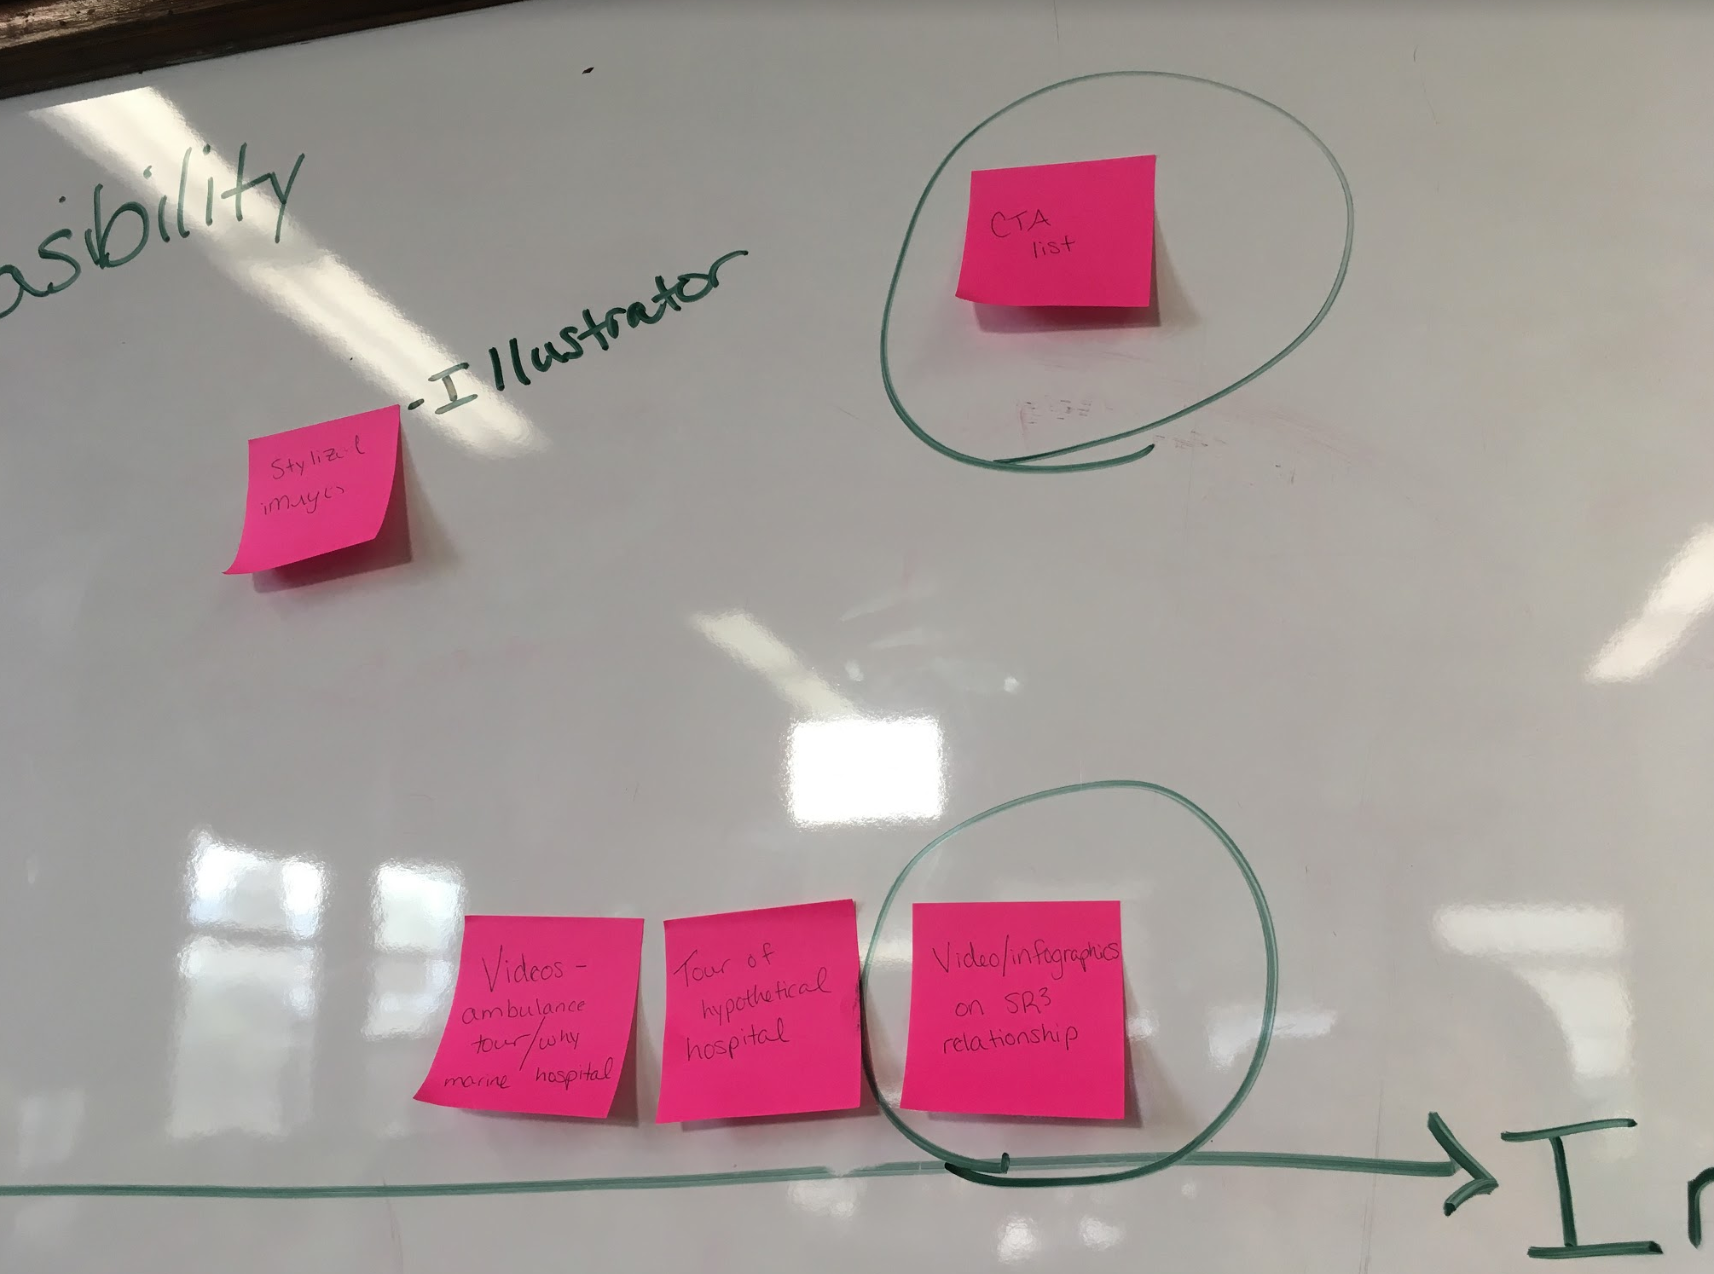
Each team came up with about 15-20 ideas to tackle these themes. Ideas included everything from coming up with innovative ways to get people involved, to making some existing marketing practices more streamlined, to creating an information video for the organization, to social media activation games, and even an app that could track people's marine footprint and informing them about how it affects the marine and human health locally.
There were many overlapping solutions that were then synthesized and evaluated based on how impactful they are projected to be versus how feasible it is to get them delivered in the timeframe we had.
06. Narrowing down on deliverables
Eventually, the team came down to the decision that the org might benefit from first cleaning up what they already have.
We quickly realized that SR3 needs a brand that tells a consistent story across media. So, one of the main deliverables and also the starting point became the messaging and brand story.
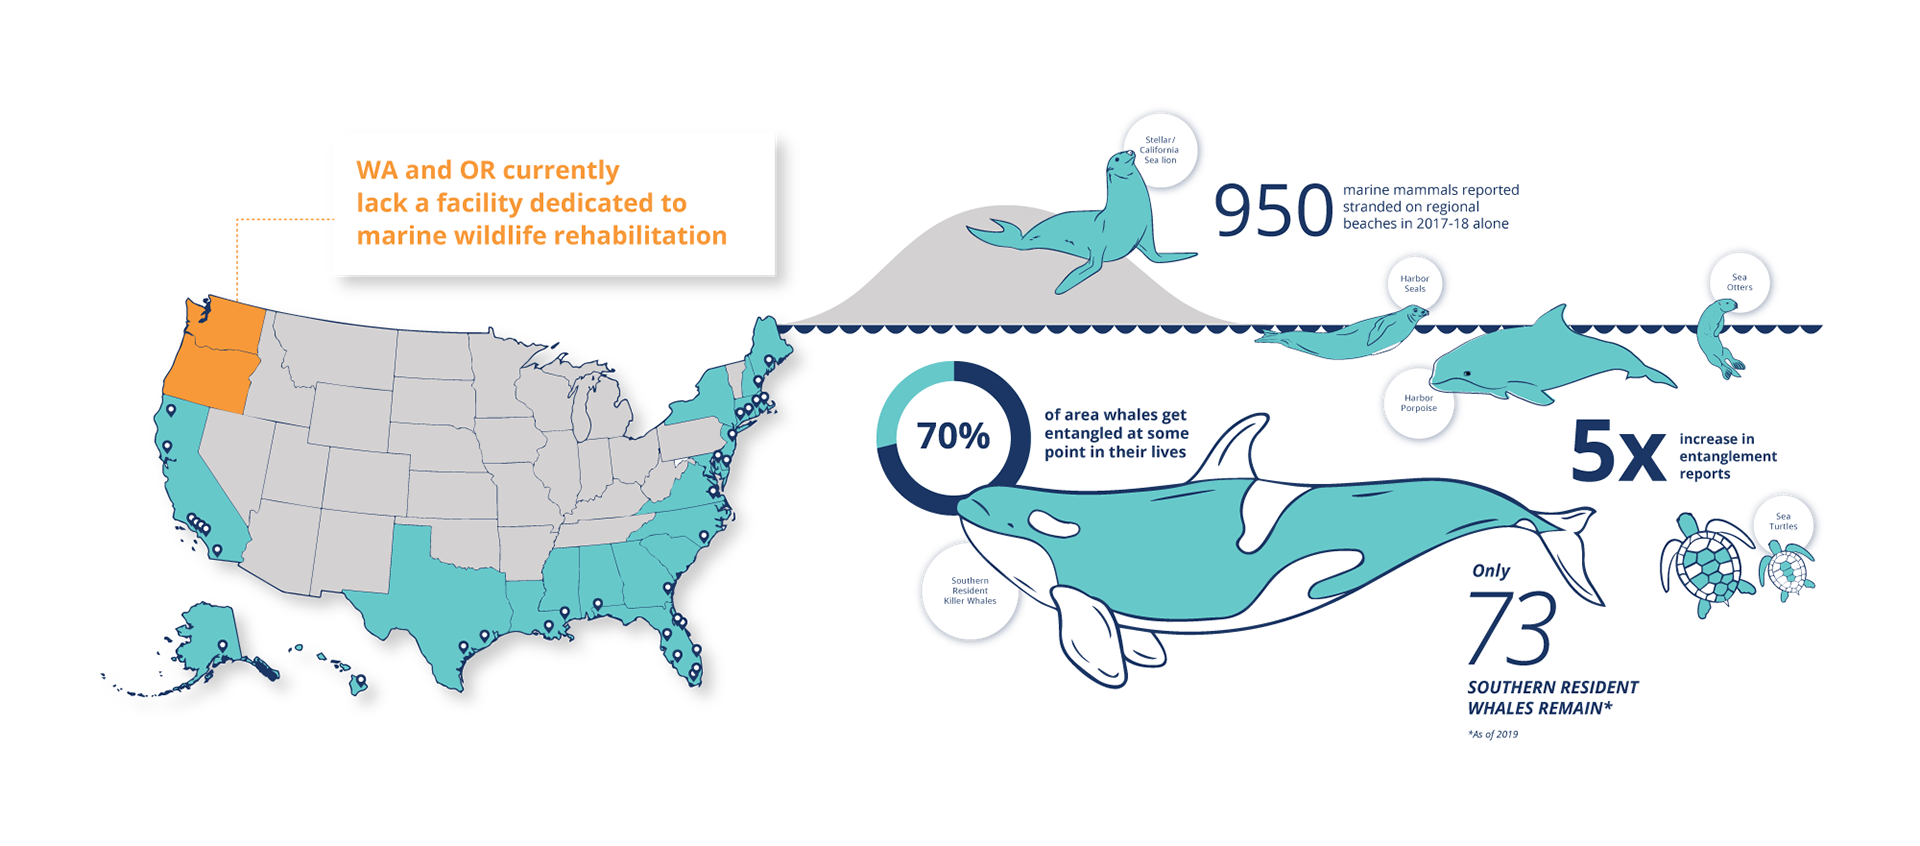
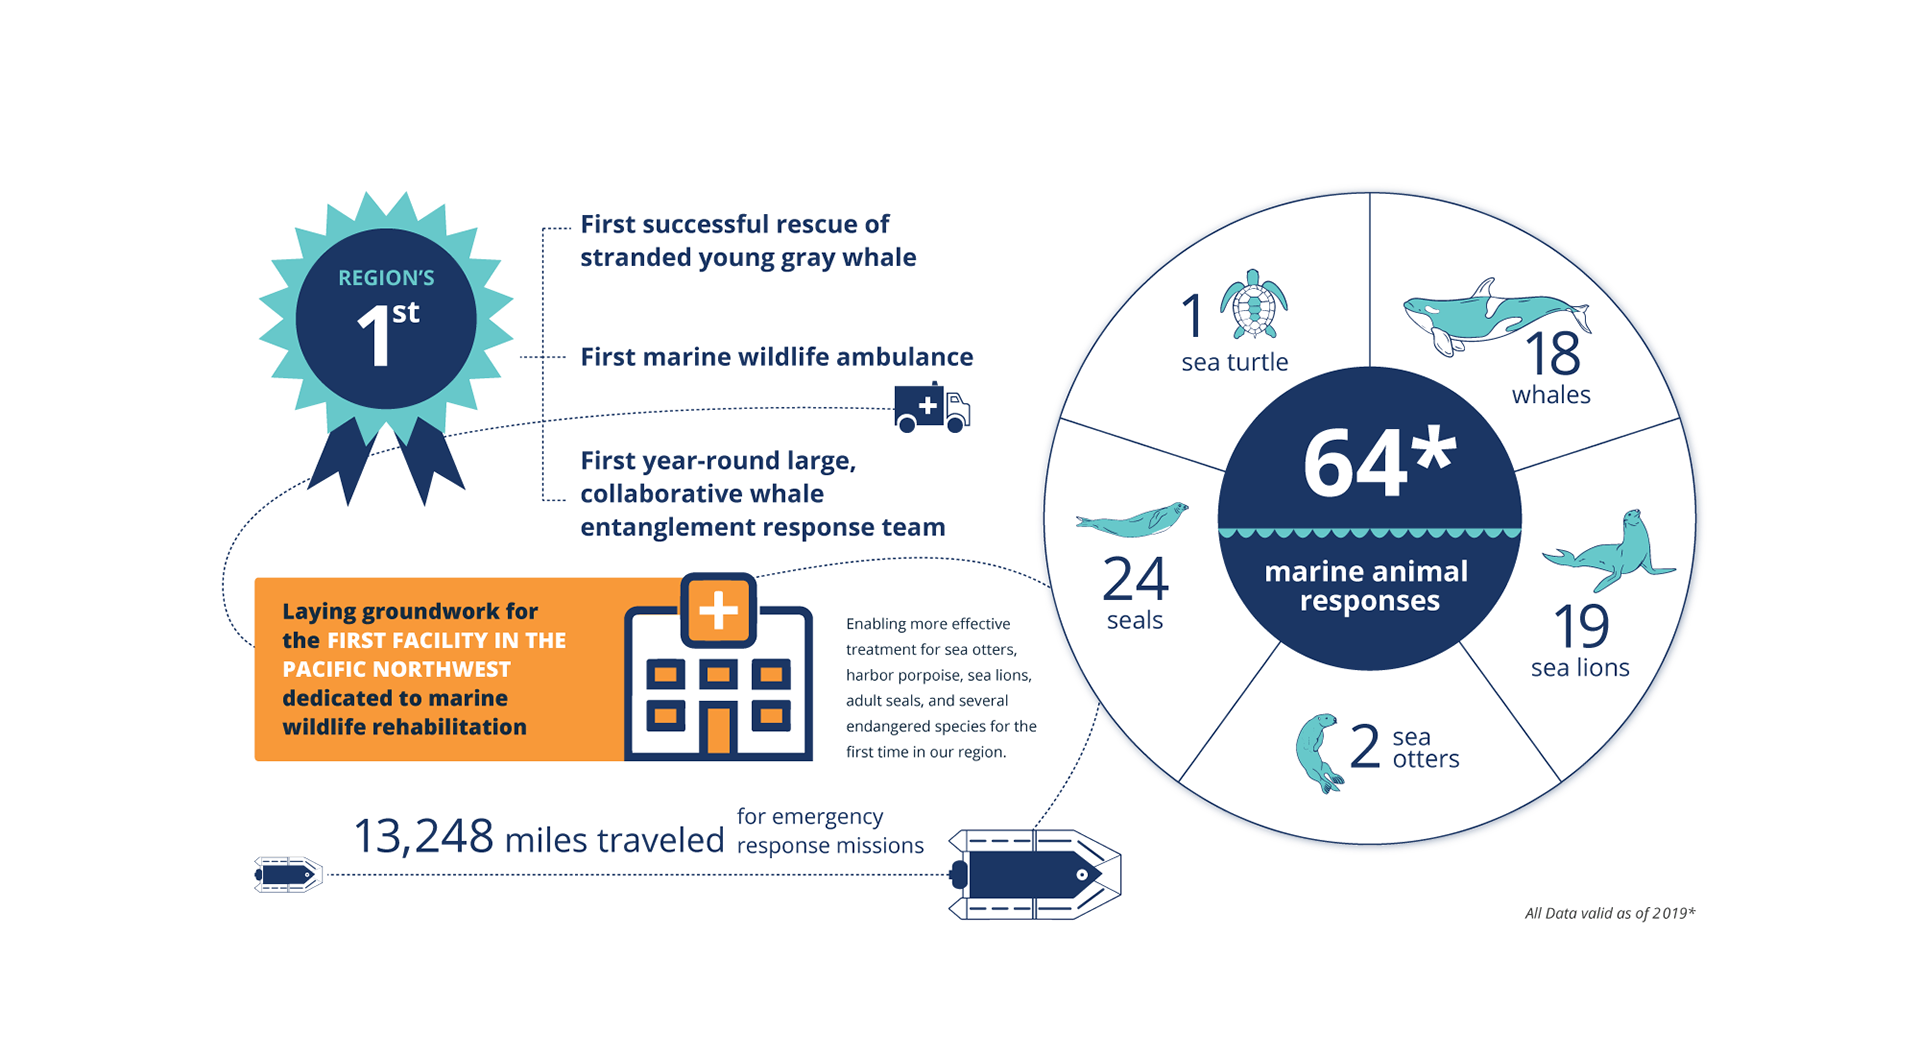
One of the important insights we found was that people were unaware of the fact that the PNW currently lacks a dedicated facility to care for marine animals and SR3 is the first to be building one.
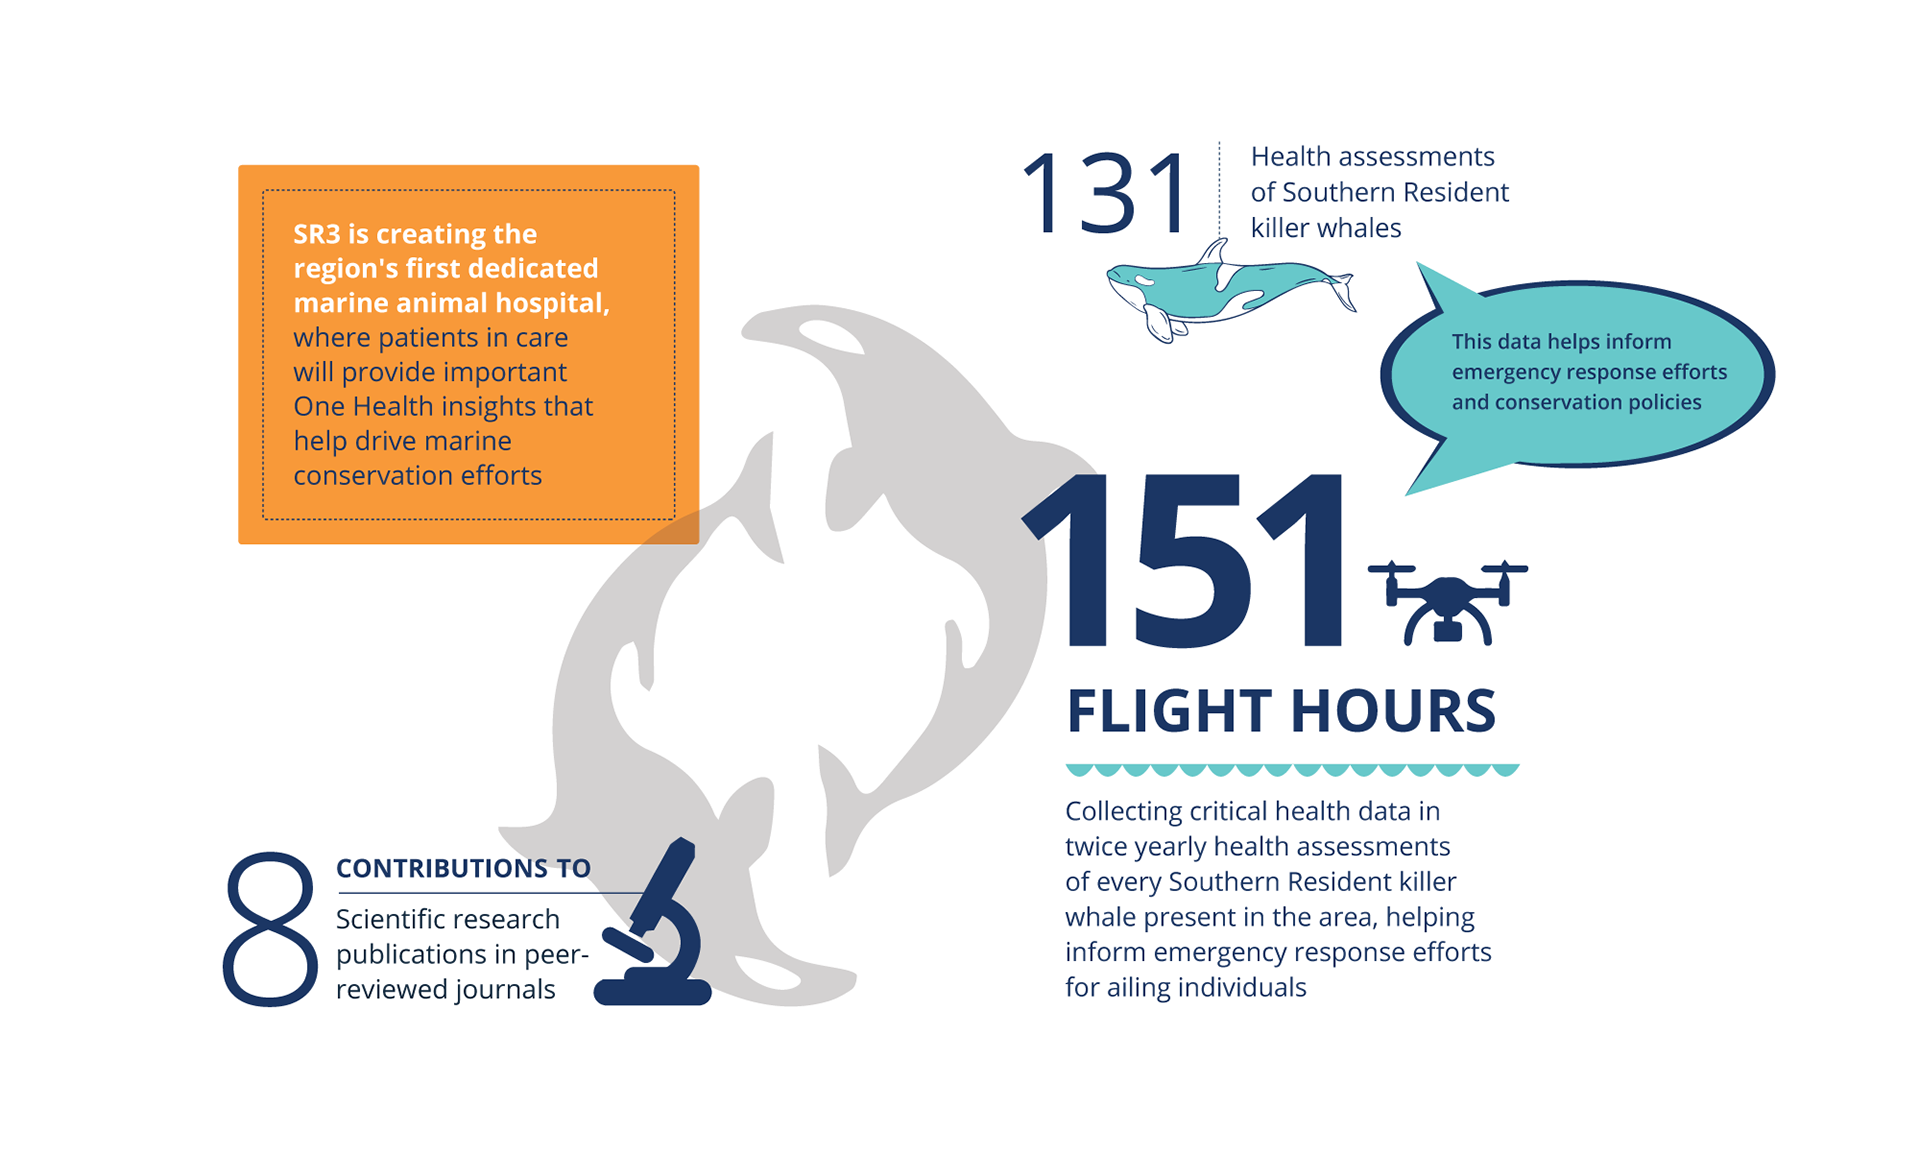
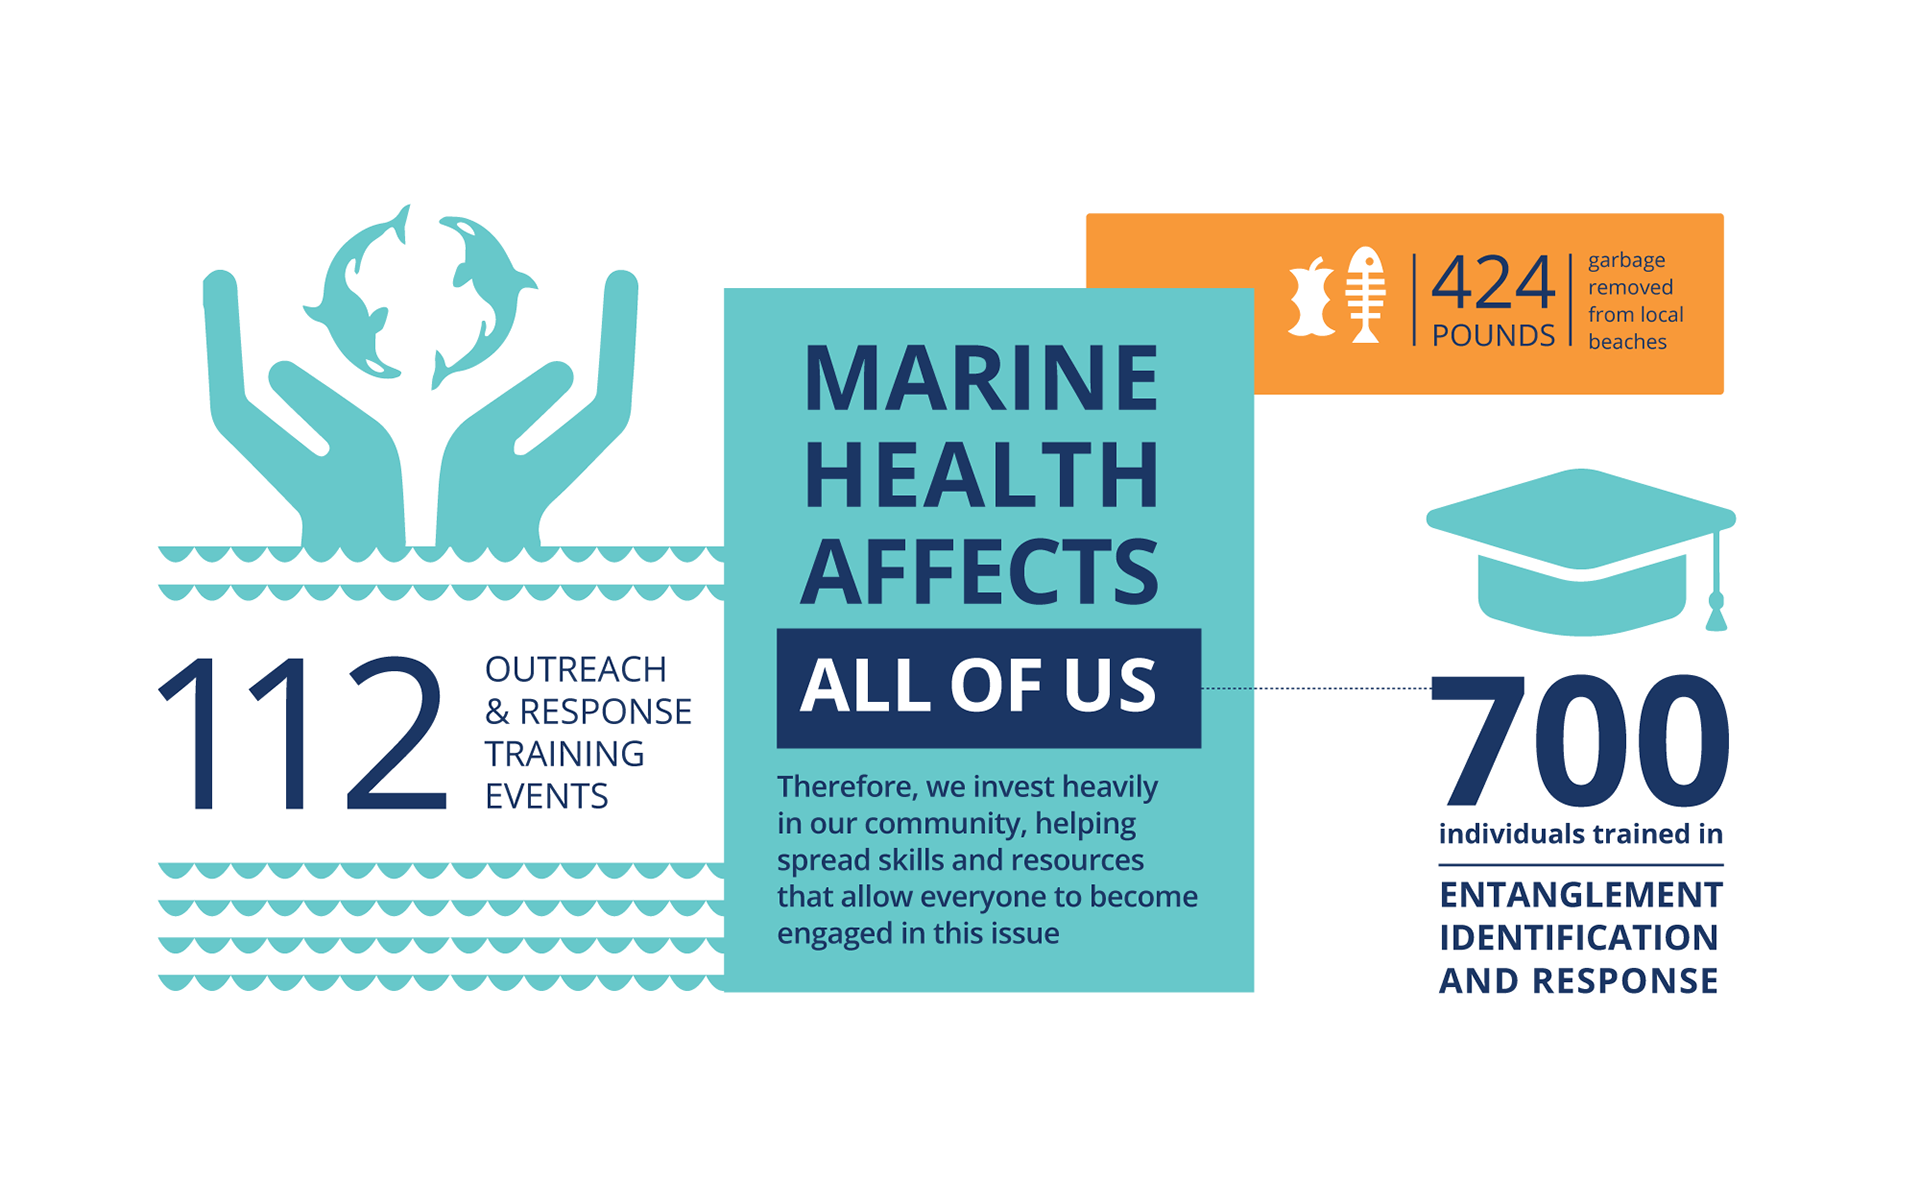
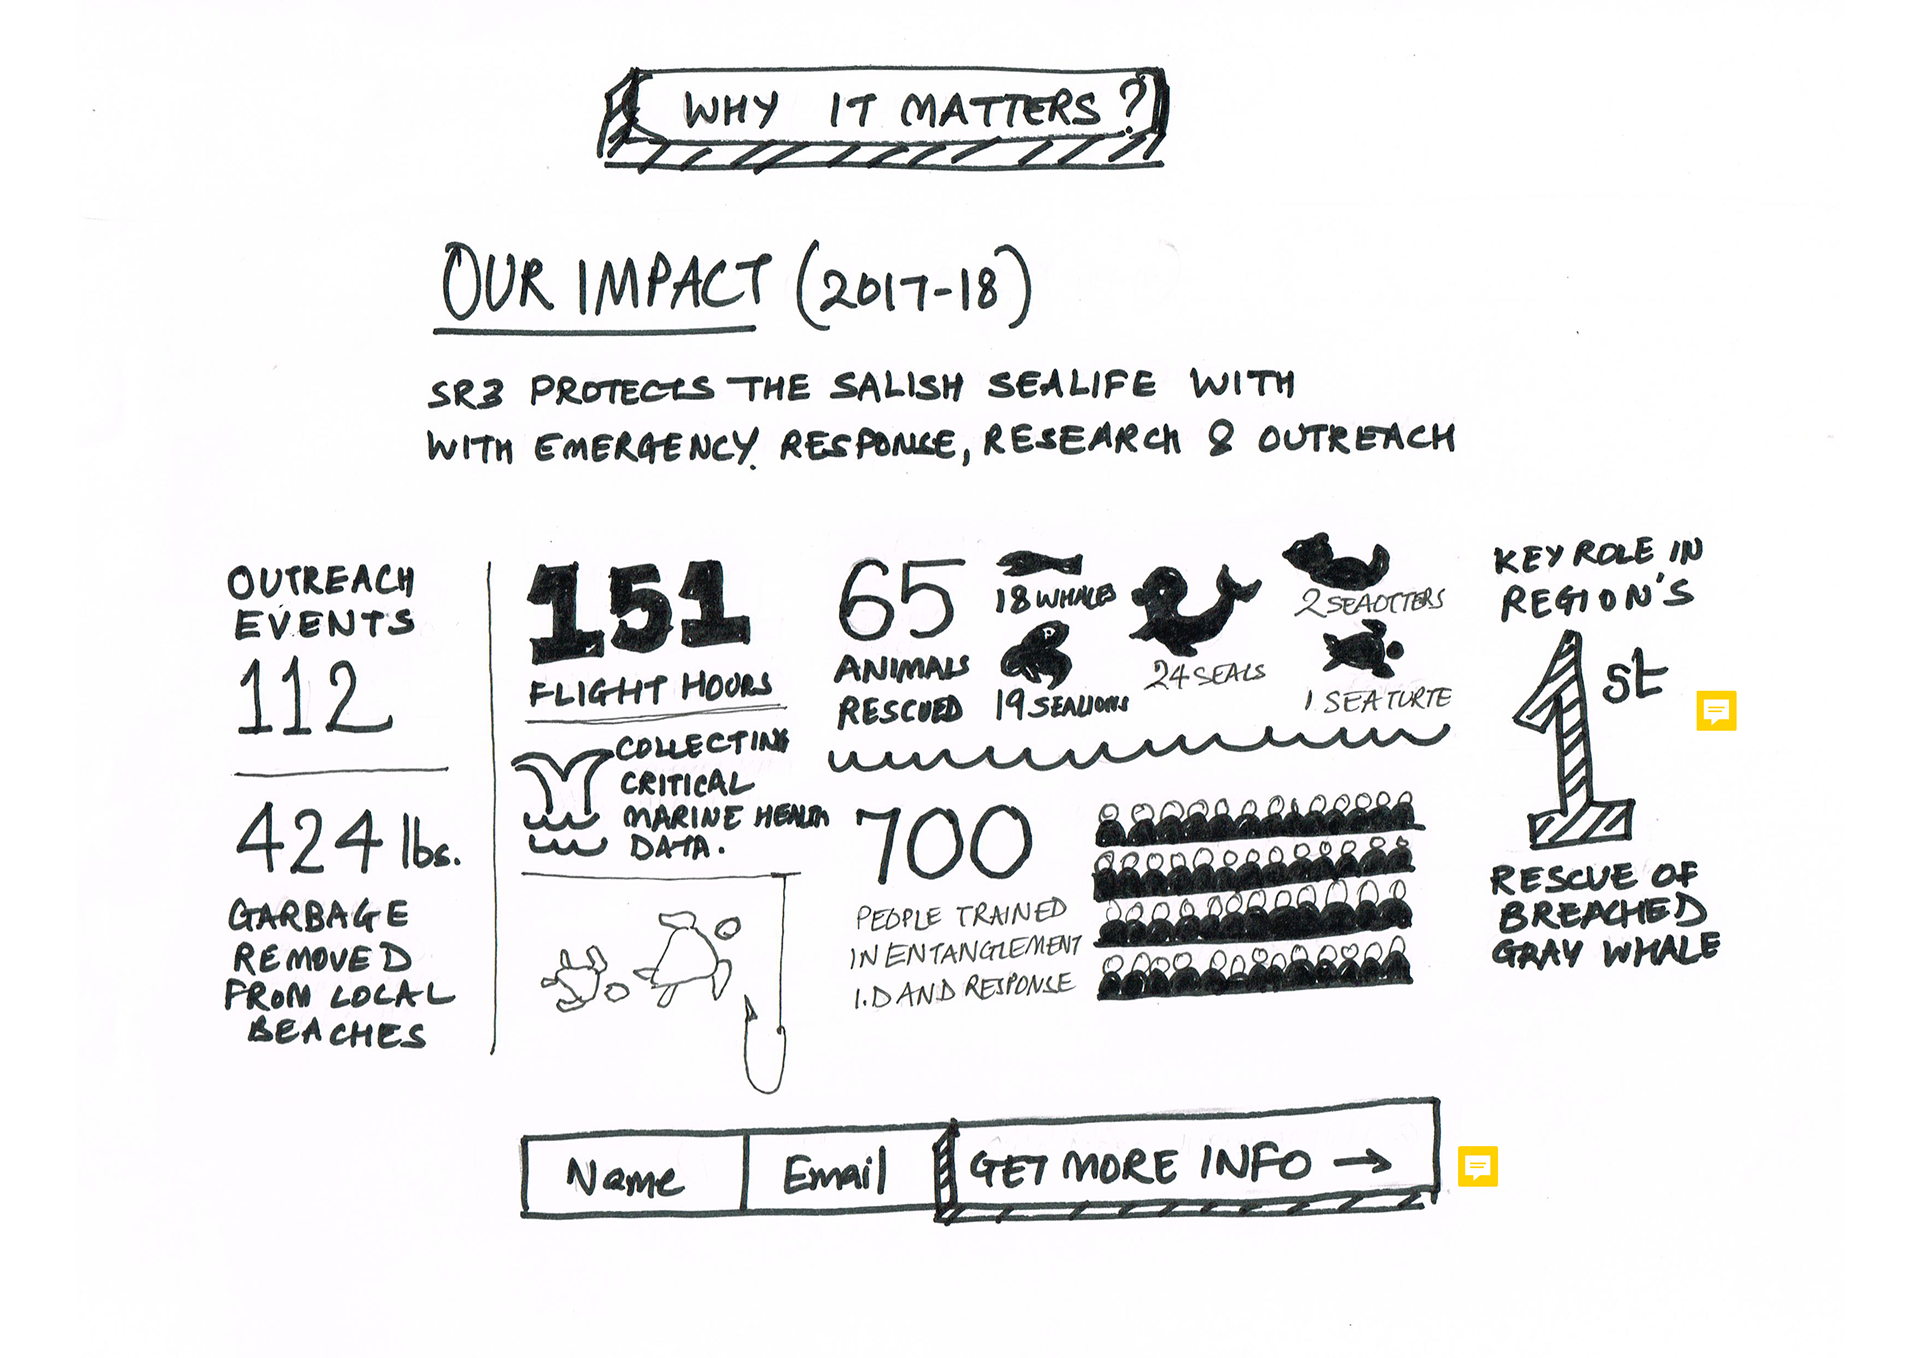
Similarly, there were many important facts such as SR3's rescue numbers, research work and community outreach work that people were unaware of. Even those, who were already involved with SR3 in some capacity. And so it became imperative to communicate these facts in the form of visual infographics that could easily be adapted to web and print media.
Through our research, we also found that people were not able to find the information they were looking for on the website. Same was the case with physical touch-points such as event collaterals. So redesigning the website and some print collaterals also became one of our deliverables.
Data-Driven Visual Storytelling
Role: Lead Designer
As per our research, we identified the following data that needed a visual storyline:
1. What is the problem that SR3 is addressing?
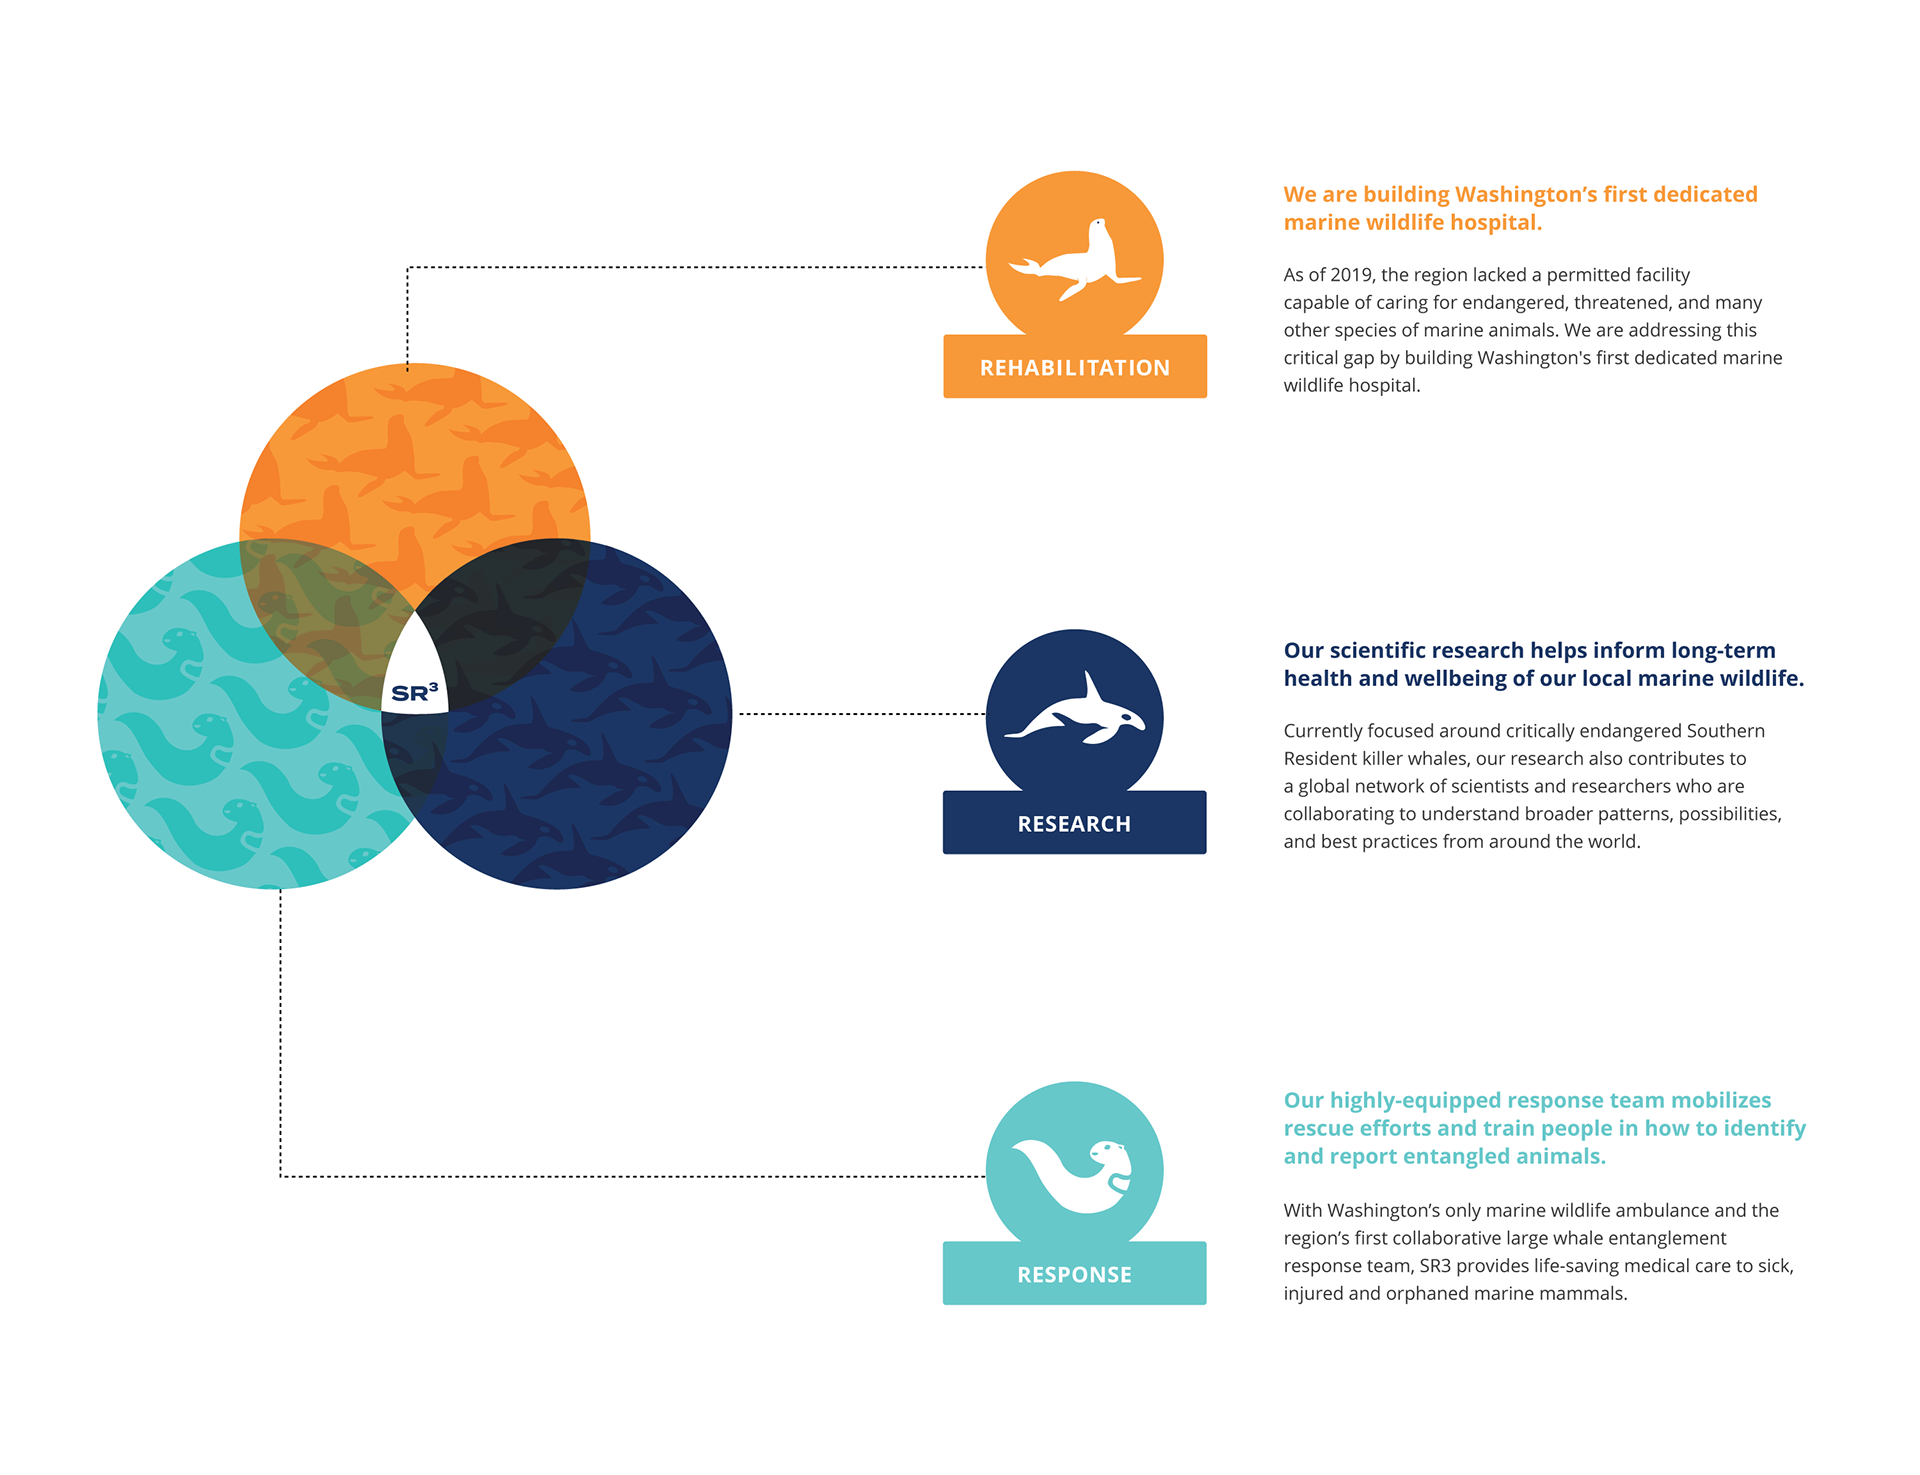
2. What is SR3 doing to address the problems: Rescue, Rehab and Research. How are they connected?
3. Real data that's action-driven that shows real impact. Eg: How many marine mammals are rescued till date?
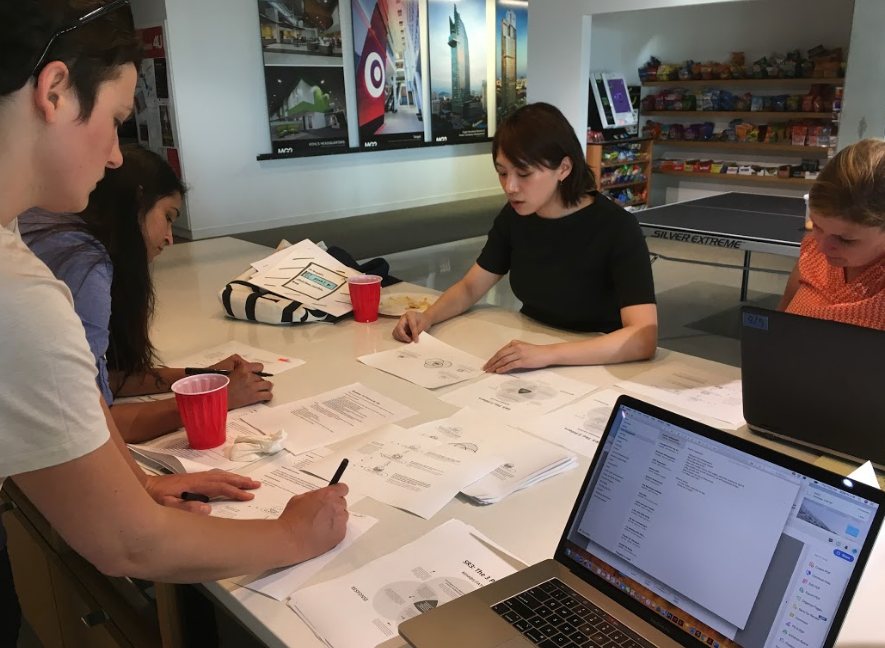
07. Sketching and testing an infographic
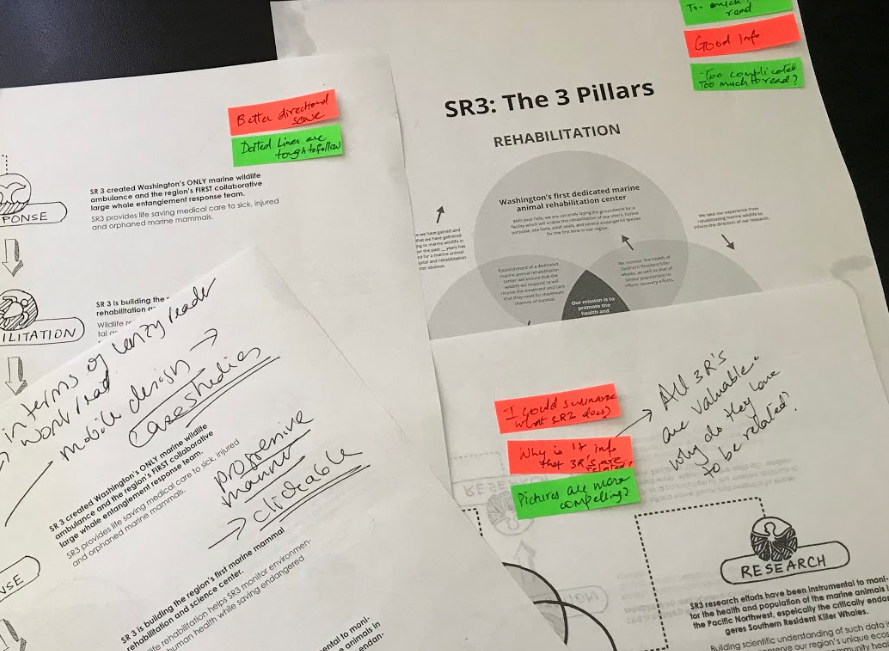
We wanted to verify the identified need and visualization of the 3 R's. So we sketched out a few variations and took them to people to see their reaction. Since all the variations were very different in terms of structure, we were able to gather important feedback that informed our final design structure. Some of the key thoughts were:
1. Venn diagram was the way to go, visually, since it tells a story of inter-connectedness without spelling it out.
2. People loved the use of icons to signify each of the 3 Rs and were generally more attracted towards the option with less text. However, they did like and even recommended having a secondary more detailed layer of interaction (Like a 'Click for more info') for those who are interested in gaining a deeper insight.
3. Does it matter if the 3 R's were connected? They seem important enough without being connected and the Venn diagram simply shows that SR3 gives equal importance to all 3 aspects, which is compelling enough.
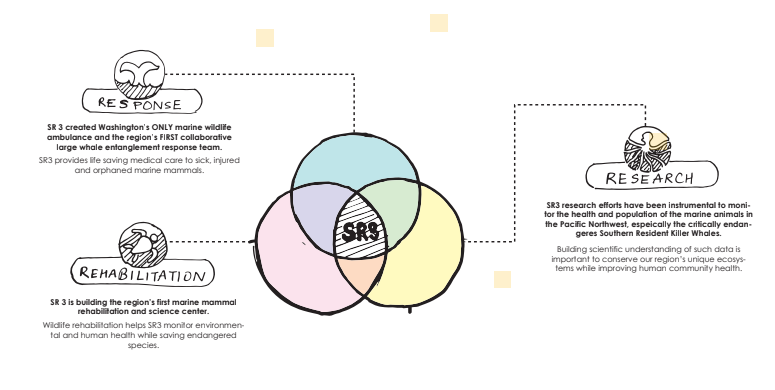
3R Infographic: Option 1
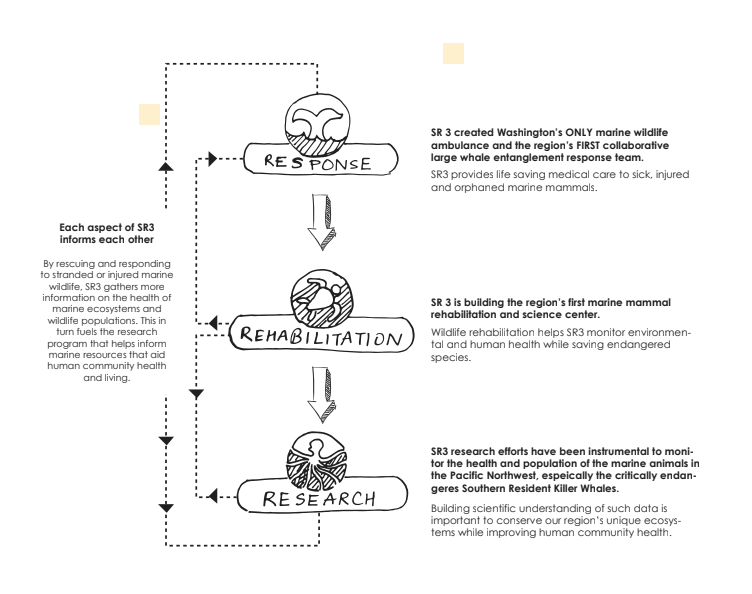
3 R Infographic: Option 2
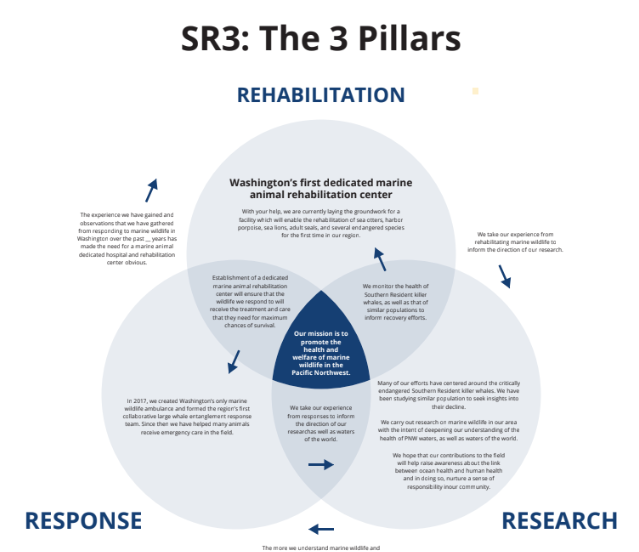
3 R Infographic: Option3
Testing the Infographic
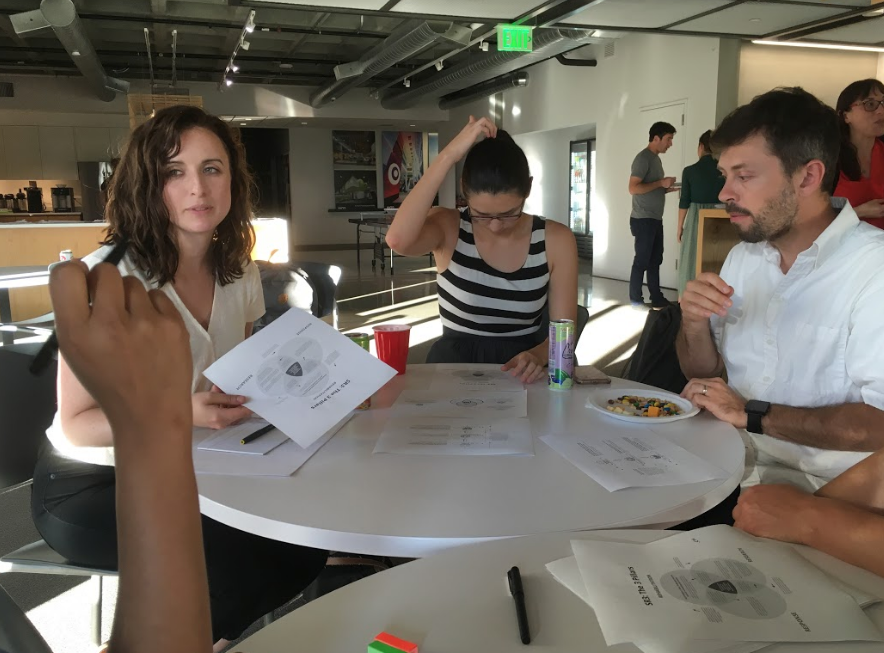
Testing the infographic
Analyzing the Feedback
08. Designing the final outcome
The final outcome includes a range of infographics that uses a solid color palette from SR3's current annual report (a small departure from SR3's logo and something the client liked and would like to take forward in all communications) and a mix of custom designed icons and illustrations of marine mammals.
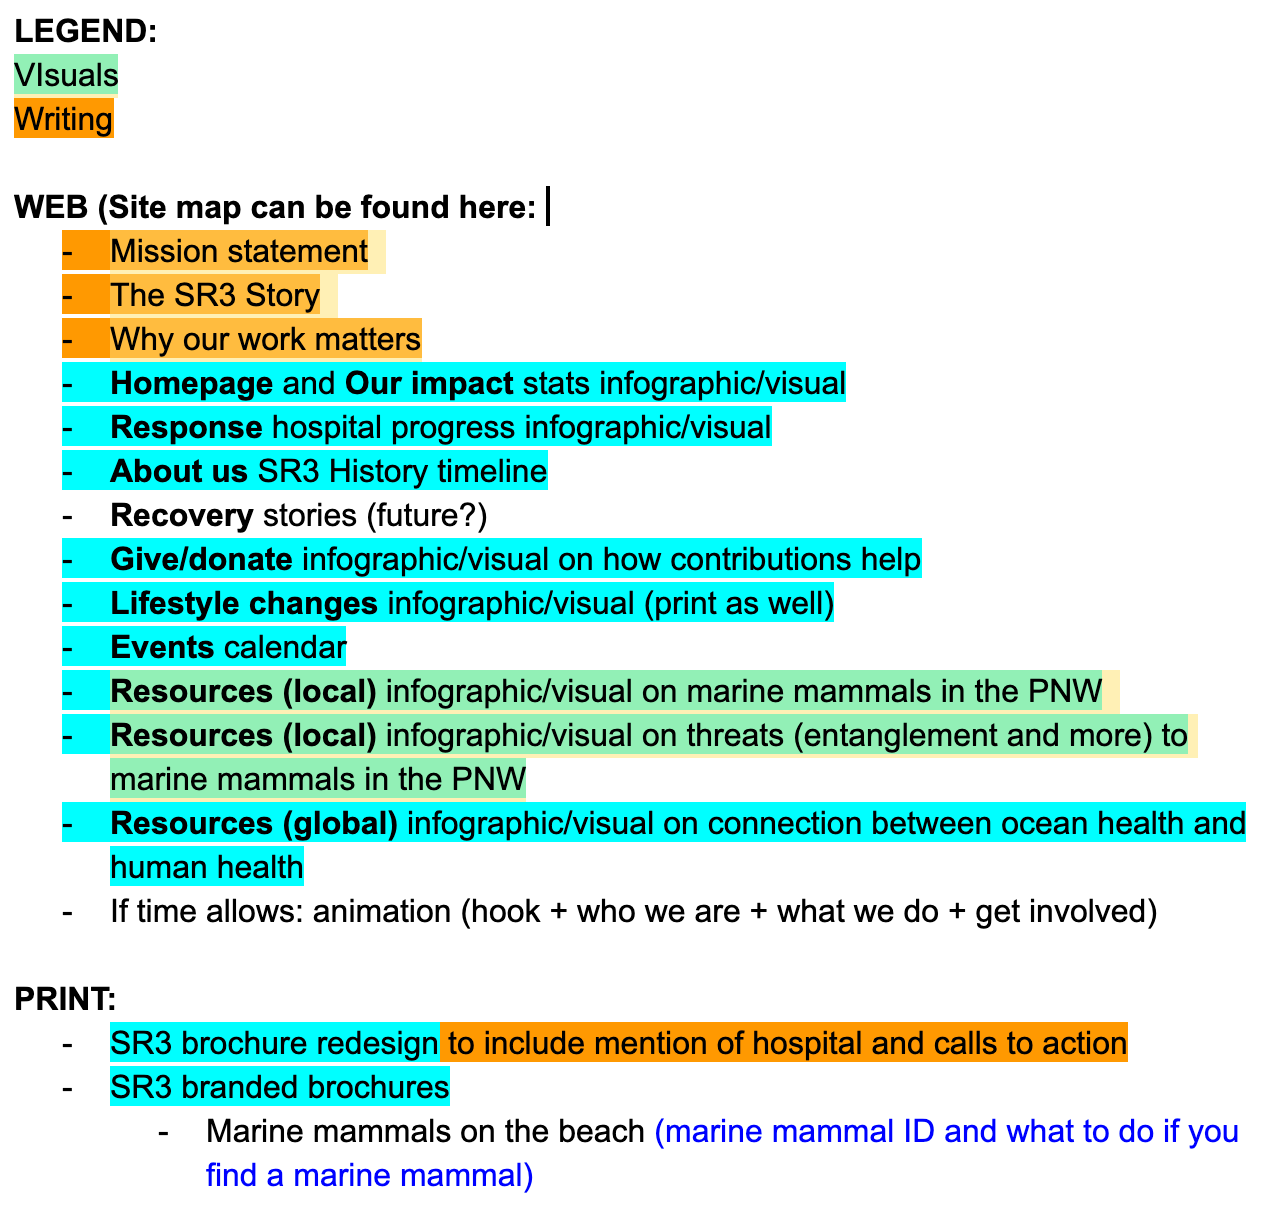
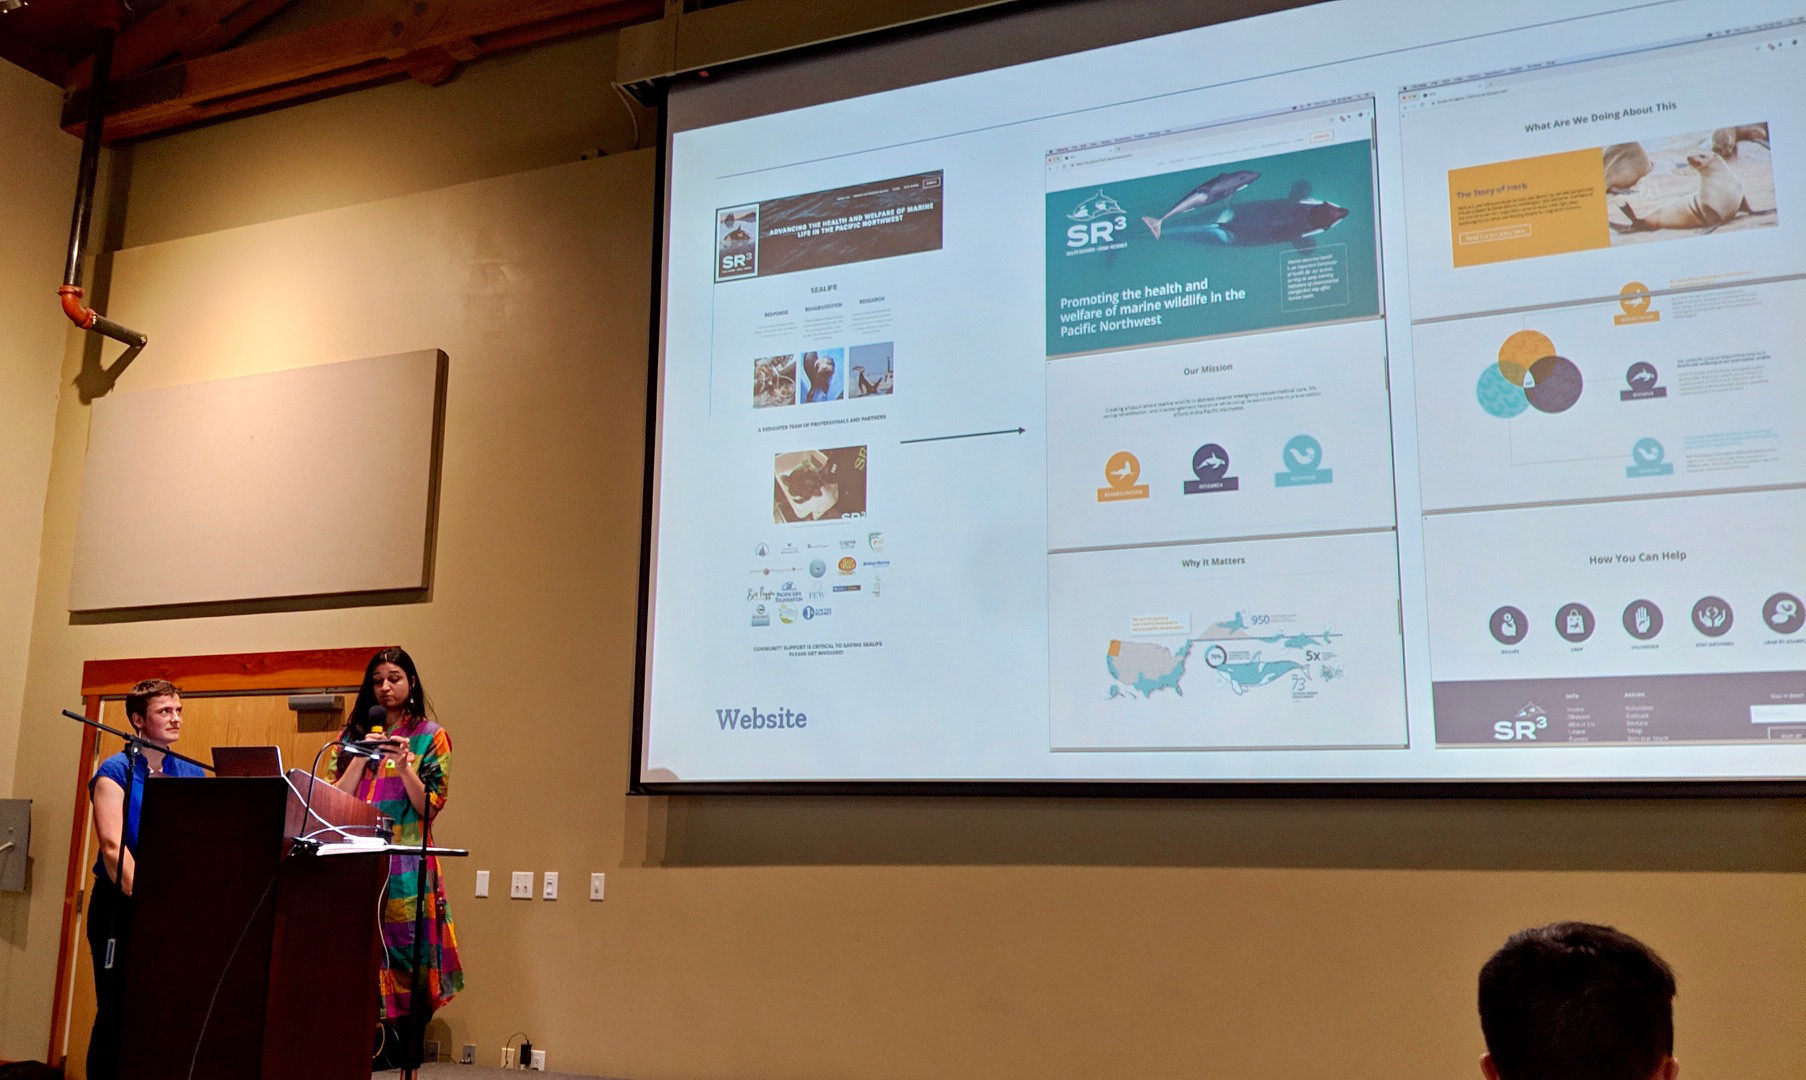
Website Redesign
Role: Assisting UX + Visual Designer
09. Designing and Testing the Sitemap
While conducting preliminary research, we analyzed different ways people were currently interacting with SR3's website and identified a few user pain points that had to be addressed during a redesign effort:
1. It was hard for people to tell at first glance what the problem area was and what was the organization doing to fix it.
2. There was very minimal emotional pull on the landing page.
3. Untimely pop-ups that ask people to buy merchandise felt a bit premature: "I want to at least know what the organization does before investing in it!"
4. "Ok, I want to help. Where can I find more information about how I can get involved?"
The following site map was proposed that became our baseline to perform further testing.
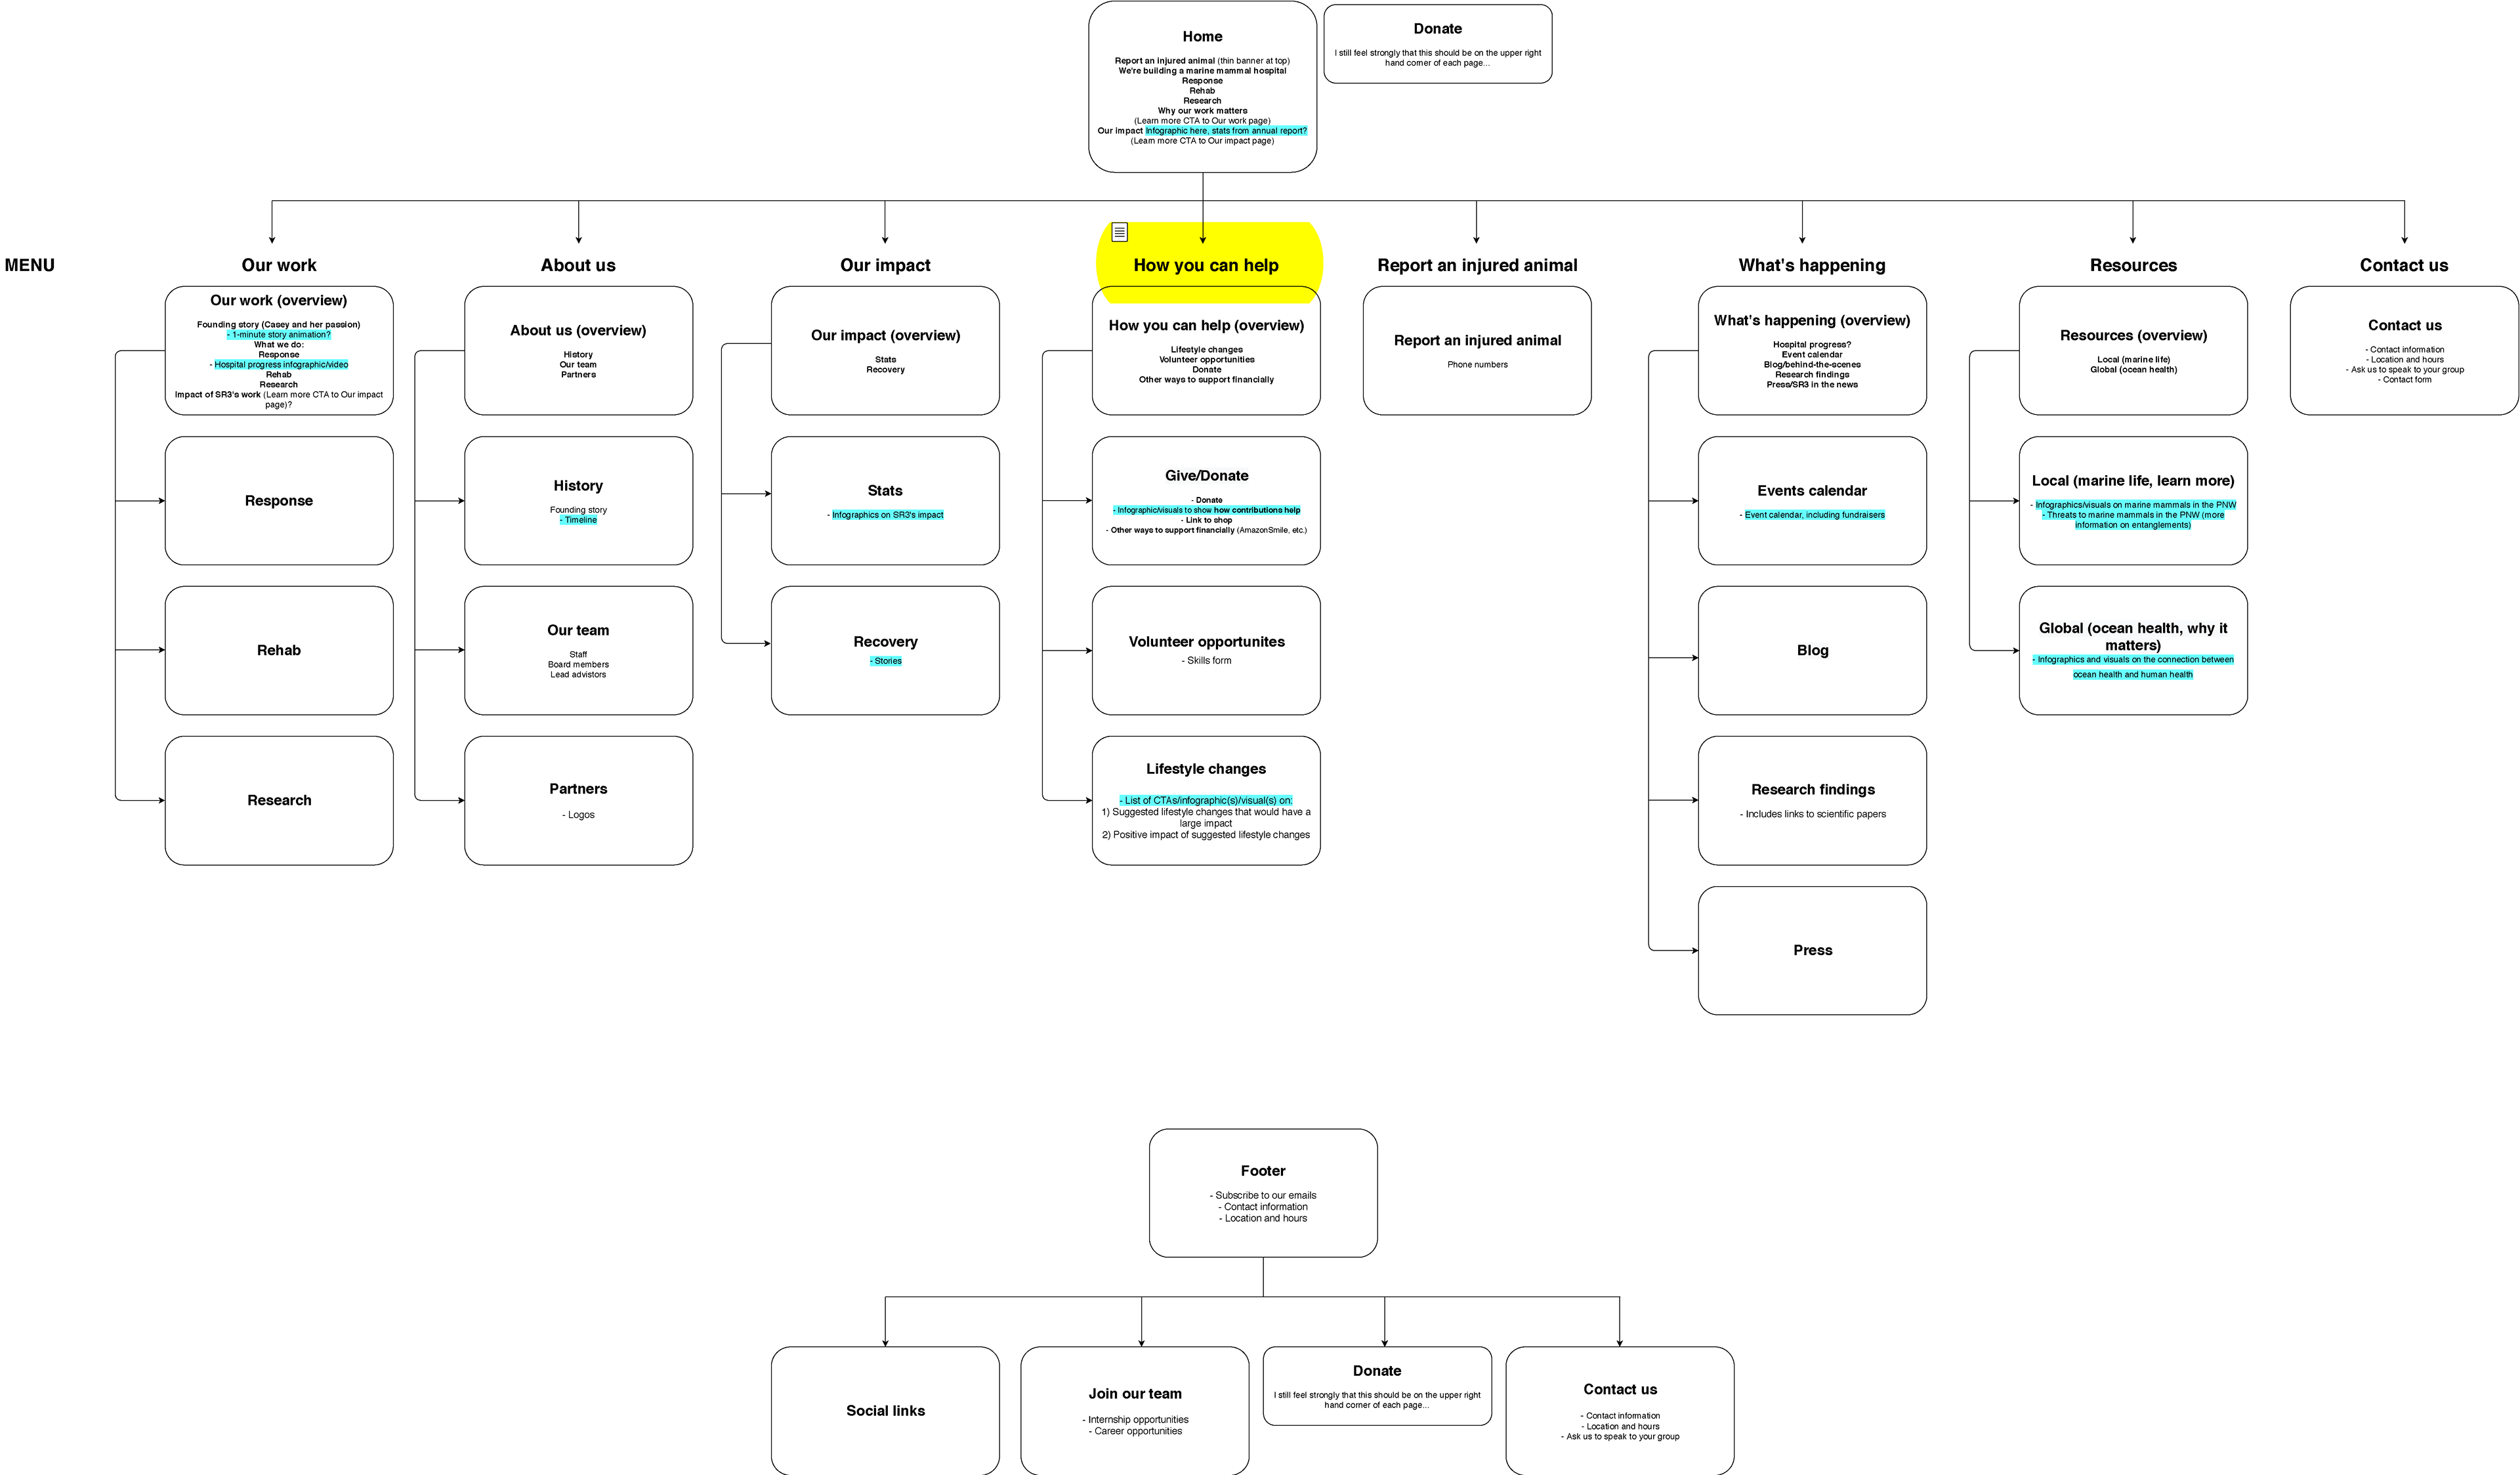
The sitemap was tested for structure and alternate terms to use as menu items using card sorting at a local event where SR3 participated. We also did an internal card sort to understand what information would live under which section on the website.
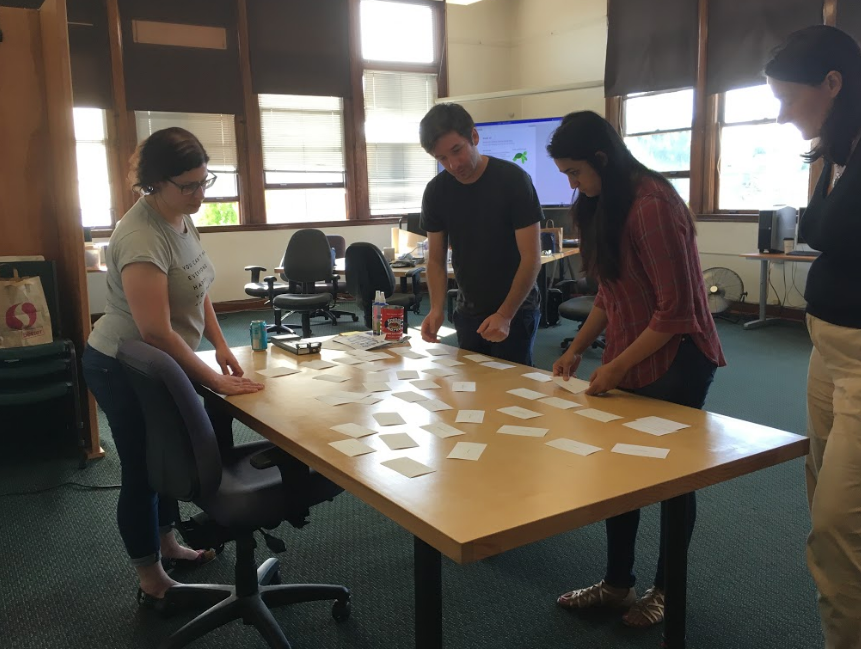
Internal Testing
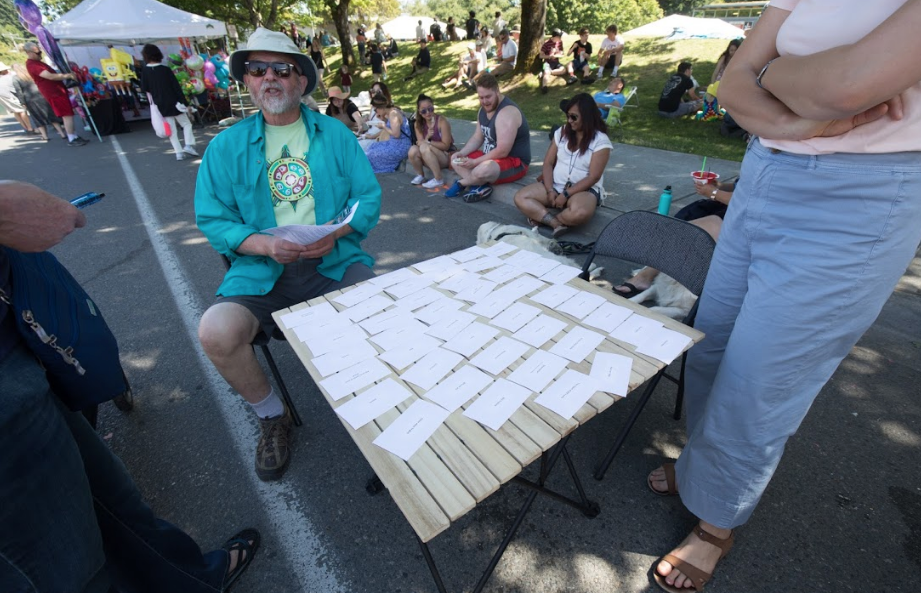
Card sort at Local Event
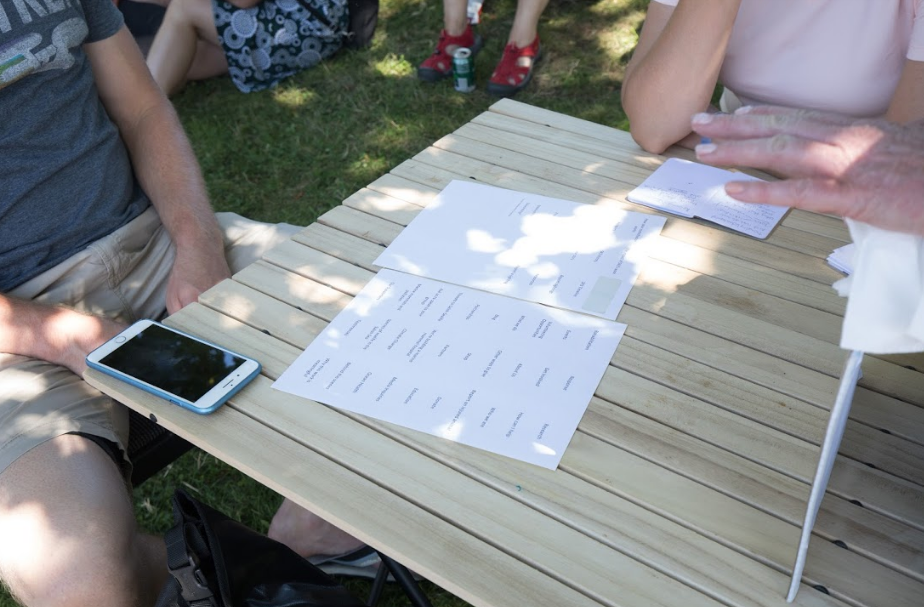
Card sort at Local Event
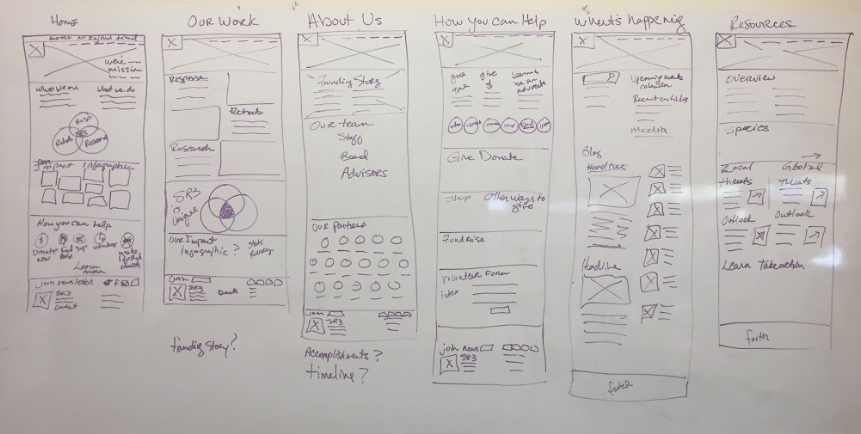
10. Creating and testing a Paper Prototype
The next step was to take our learnings from the card sorting exercise and sketch out a quick, low-fidelity paper prototype. We took this and tested it with the AIGA team and received some invaluable feedback in terms of number of menu items, flow of information, infographics and call to actions.
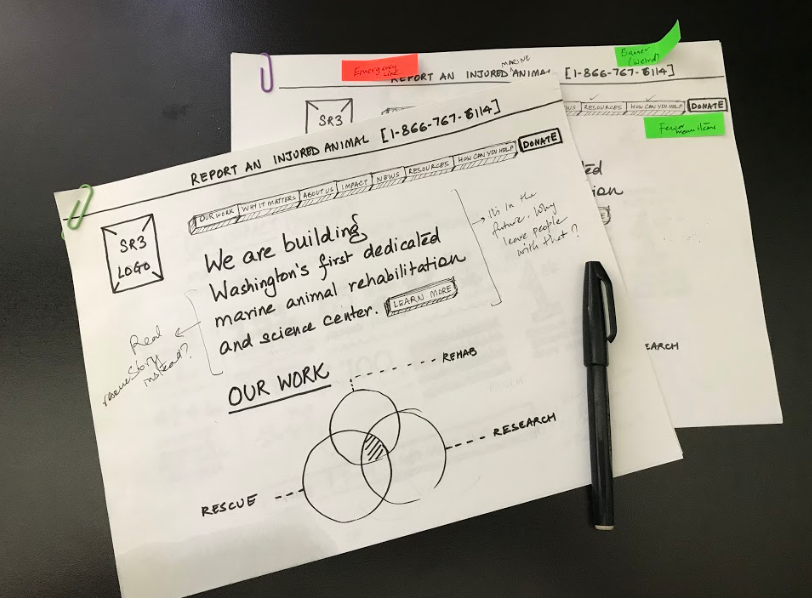
Landing Page Paper Prototype
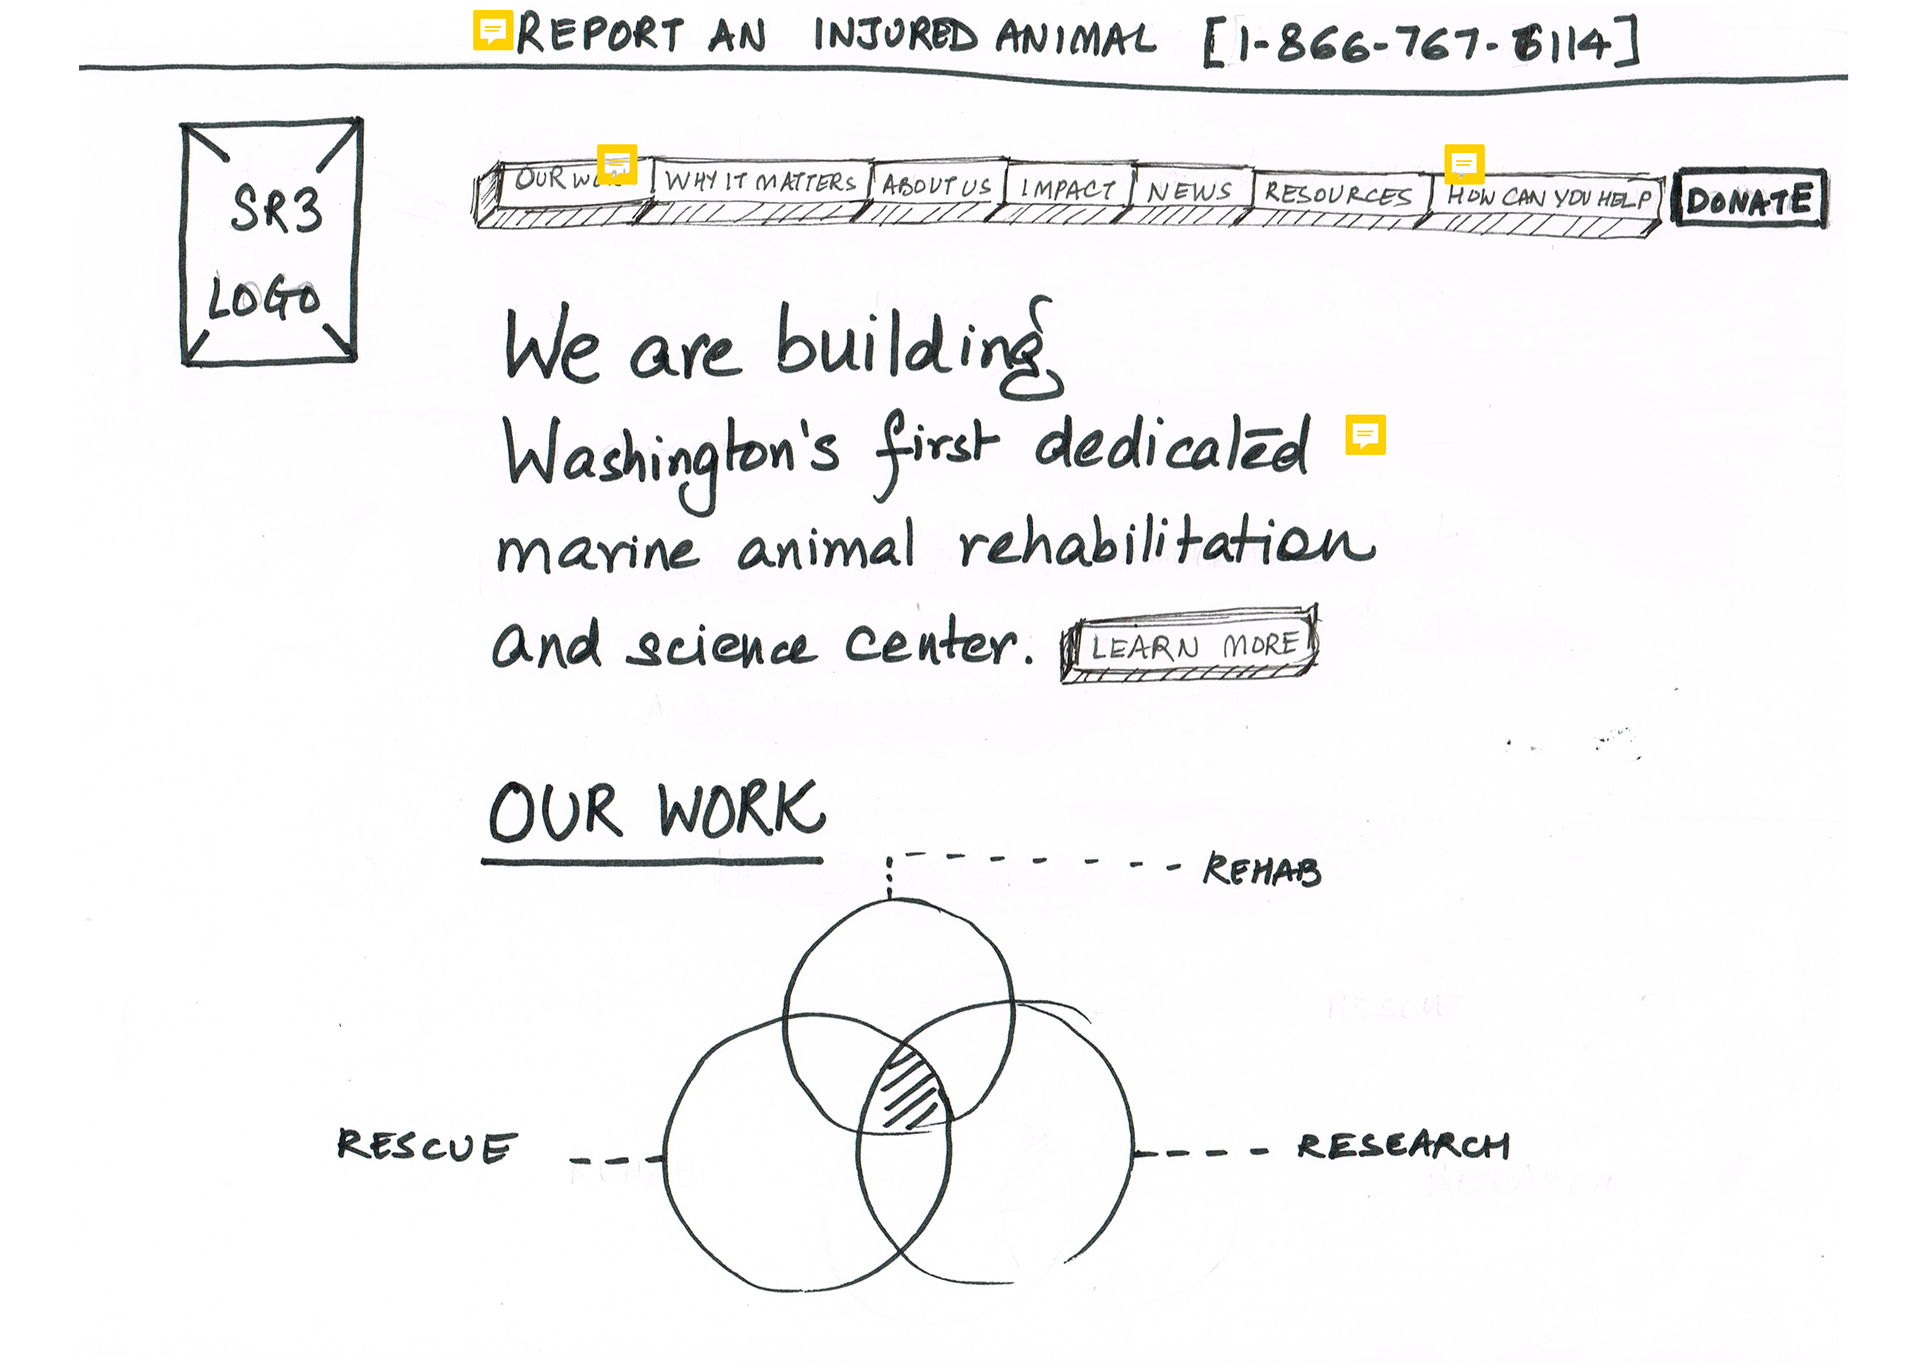
Landing Page Paper Prototype: Page 1
Landing Page Paper Prototype: Page 2
Landing Page Paper Prototype: Page 3

Testing the Prototype
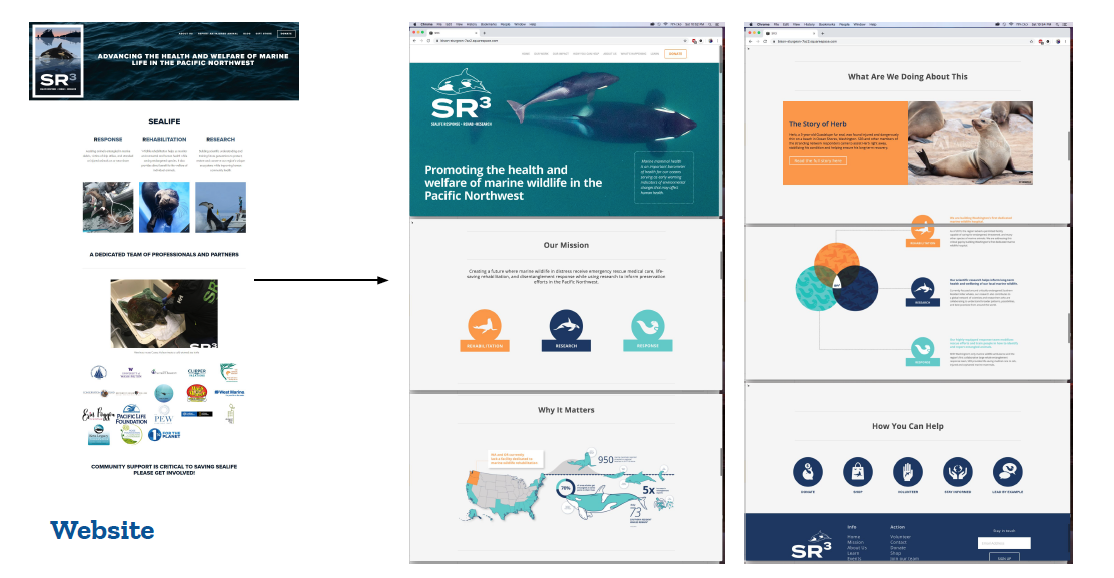
11. High Fidelity Prototype and Squarespace Implementation
The next step was to take our learnings and create a high fidelity prototype for the entire website that could then be modeled into creating a functional website on Squarespace (SR3's current web-hosting platform).
While we are in the final stages of completing a high fidelity prototype, the final website implementation is still underway and may alter the design of the web pages due to template limitations on Squarespace.
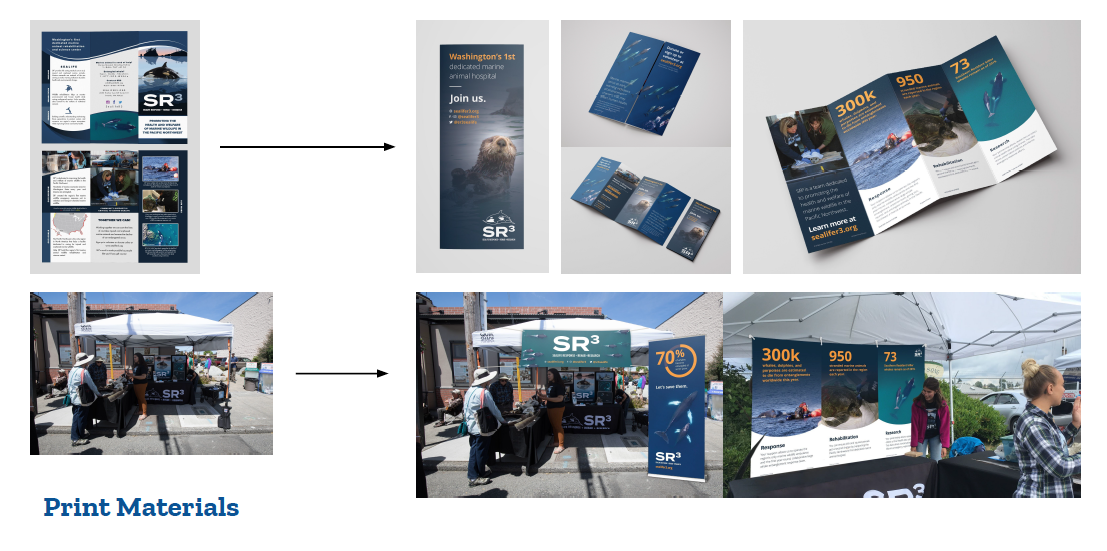
Idea Book & Other Print Materials
Role: Contributing Ideator
We also redesigned SR3's printed brochure and booth signage to be more in sync with the new messaging we were proposing and something that stated the problem, SR3's role in tackling it and clear call to actions to drive informed action.We also decided to provide client with an idea book that consisted of all those ideas that we came up with that were either not feasible in terms of time or resources at this point, but rated high up the impact scale and would be a great resource for the client to use in the future.
Results:
The client is happy to receive important user insights that were not clear to them before this project and is excited to see the impact of all the new resources they have received from our team.
Their new hospital is already in construction stage and is slated to begin all functions by April 2020 and hence become the first marine mammal rehabilitation center in the Pacific North West. They are hoping to launch the newly designed website around the same time and a few of us from our team are excited to continue supporting SR3 by helping with website implementation.
We also hope to revisit SR3 later in 2020 to see how the new website and resources might have impacted their goal and impact.
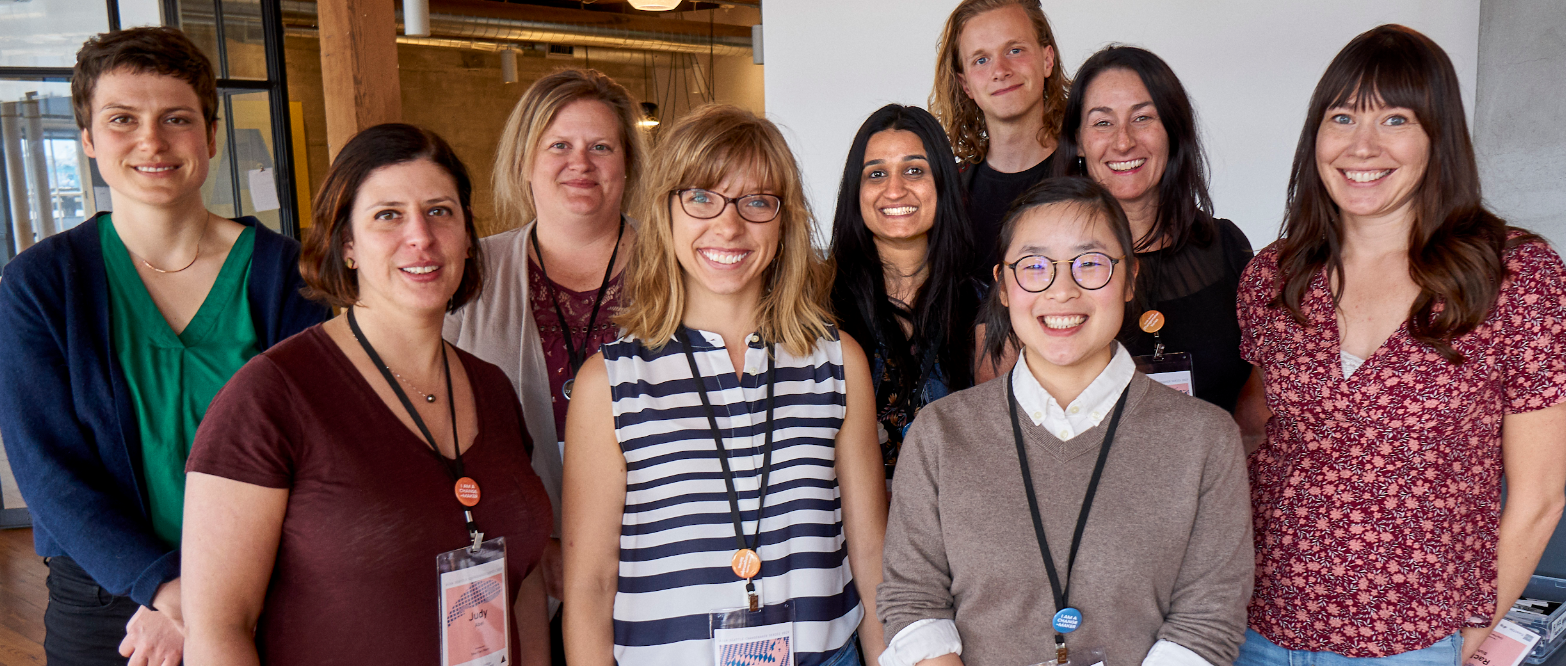
Our Team, working cross functionally:
1 Strategist
1 Writer
1 UX Researcher
2 UX Designers
2 Visual Designers
2 SR3 Staff Members
1 Writer
1 UX Researcher
2 UX Designers
2 Visual Designers
2 SR3 Staff Members